data viz challenge... how teens research
I subscribe to updates from the Pew Research Center. It's a great way to ensure a consistent inflow of data, which is useful as I gather and examine examples for workshops and my blog. Often, the incoming email gets quickly scanned and archived. But last week one of the titles piqued my interest, so I clicked to learn more about How Teens Research in the Digital Age.
When I think back to my own research projects in high school, I have images of trekking to the county library and using large computer terminals to locate old news articles on microfiche. Or making the even longer journey into the city to utilize the massive book collection at the university library. (I grew up in the sticks and when I was younger, these truly did seem like Illiad-like voyages...adventures to the city even involved a ferry boat!).
As I suspected, the means for researching for teens today are very different. They don't even have to leave their house (or their room!) if they don't want to, since the internet, and thus the world's information, is at their fingertips.
Alright, that's sufficient prelude. You're probably wondering about this data challenge that I mentioned in the title. On to that. I was surprised reading this article how many stats were included and yet how few visuals. Only one graph, in fact:
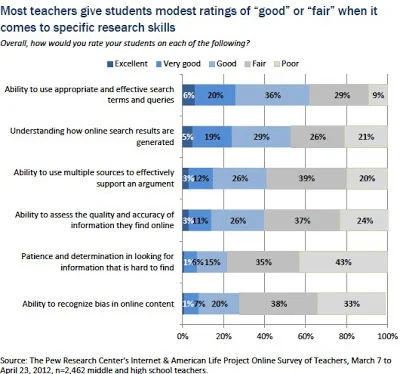
My challenge to you is this: read the article and determine what data you find most interesting then visualize it. You can remake the above graph, or focus on bringing life to numbers included in the report by making them visual. Submit your entries via the following instructions by Sunday, November 25th (those in the states need something to do over Thanksgiving break, right?).
When complete, you can leave a comment with the story you would focus on and a link to your visual, or email it to me directly (cole.nussbaumer@gmail.com) along with any comments you'd like me to post with it, and I'll put it into Dropbox and create a comment for you with the link (if you don't already have a Dropbox account, this is a good reason to get one!).
I'll invite the creator of my favorite to write a guest blog post. Happy data visualizing!