visualizing opportunity
When visualizing survey data, it's always seemed to me like showing where you're at is only part of the picture. There is important context that comes with where you could be. I had a workshop last week where we discussed this idea in the context of a specific example and I thought I'd continue that conversation here. What do you do when you want to show not only a summary metric, but also give a visual sense of the potential or opportunity?
The data that prompted this conversation was initially shown simply in a table. There were several survey items down the left hand side, with quarters over time listed along the top. Within each cell of the table, two values were listed - the average rating (with responses falling on a scale from 1 to 5) and the "top box" (the latter is a common measure in customer satisfaction or CSAT analysis, that combines those at the top end of the scale, typically those responding "Agree" and "Strongly Agree" or the responses corresponding to 4 and 5 for the given survey item). To illustrate, I'll show just one of the rows from that table (I've changed the details to protect confidentiality):

It's a clean, simple table. Still, we can improve upon it. I'll go through a few different views. First, if I were designing this table, there are few steps I'd want to take to declutter it:
- Remove the blue background in the top row of cells. Color can be used more strategically than this. In this particular example, I stayed away from color altogether, except in the heatmap that we'll look at momentarily.
- Pull years at the top out into super categories and then have categories of quarter within that, eliminating the need to repeat years across the column headings.
- Remove the sample size (N). If there isn't anything super interesting about it, this is typically more like footnote material, so let's imagine I have a footnote that says something like "Number of responses is relatively consistent over time, ranging from 350 to 472 over the quarters shown." (Related thought: in cases where the numbers swing by a lot, I would want to keep the N directly in the table so that can be taken into account when interpreting the numbers, but here they are all sufficiently big enough that I don't think they add much, so I can reduce the clutter they add to the table and capture in a footnote instead.)
- Focus on a single metric. Multiple metrics tracking pretty much the same thing can become quickly confusing and unnecessarily complicate discussion. In this case, I chose to focus on the average, because I think it's easier to wrap my head around than the top box, but different scenarios would call for different decisions here.
Here's what my resulting table looks like:

When I see a table, however, typically the first thing I want to do is try to visualize the numbers. We can start by doing that directly within the table, using conditional formatting to apply a heatmap where relative saturation gives us a visual sense of relative numeric values. Here's what that could look like:

I chose to draw the most attention to the negative end of the scale, making lower numbers a higher saturation of orange and higher numbers lower saturation of orange. Here, we see that Q2 2014 is markedly below BENCHMARK and that numbers go up (becoming less orange) over time as we move rightward across the table.
We can take it a step further and visualize the numbers in a graph. We're looking at data over time here, which means my brain goes first to a line graph. Here's what it could look like:
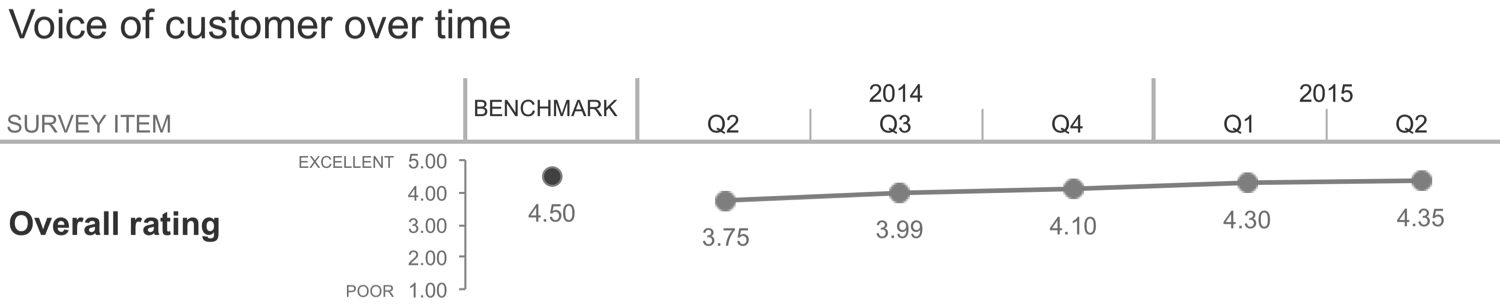
I've preserved the same overall tabular structure when it comes to rows and columns (the original version had more survey items than this, so you can imagine additional rows, each with a line graph similar to this one plotting the respective data). I can now visually see the increase over time. I've implicitly assumed that the specific numbers are important enough to label directly (but also provided the axis on the left, so I can attach the labels EXCELLENT and POOR right to the numeric scale they've been turned into). As I look back over this, I realize throughout that I probably should have made it clear that the metric that's being plotted is the average across survey responses, so let's imagine I've done this.
Going back to my post title - one of the things I want to show in this case is the opportunity. Line graphs don't really provide that. Sure, we can see it's a 5-point scale and that the line is lower than that. We could even draw a line along the top (or extending out from the BENCHMARK point to highlight that we've improved but are still below it). Or, I can build in this idea of opportunity into every data point by visualizing the unachieved potential on top of our current data:

Personally, I like this last view the best. If I were only showing the "Overall rating" (as above), I'd probably want to make the bars a bit taller so you could really see what's happening over time. But in more of a dashboard view where you're looking at many survey items at a time (imagine row after row similar to this) the current view can work well for being able to see what the data looks like over time, where we are relative to benchmark, and so on. I like the use of the unfilled outline to give this visual sense of where we could be.
If it's of interest, you can download the Excel file with the above visuals here.
What do you think of this approach? What other scenarios have you encountered when it is useful to show potential or opportunity? What strategies have you employed? Leave a comment with your thoughts!