member spotlight: Gary Buckley

The following is a guest post from Gary Buckley. Gary regularly contributes to the community by completing #SWDchallenges and leaving comments for his fellow community members. To see some of Gary’s work, check out his gallery page. Keep reading to learn about one of Gary’s preferred brainstorming tools to generate creative ideas, build presentations, and even choose an appropriate visual. Don’t forget to pop over to the community to chat with him directly as part of our latest Member Spotlight.
Each month, we select someone from the community to highlight through our Member Spotlight. These are people who contribute in ways that foster an even more connected and diverse learning environment. Our goal is to help you get to know your fellow community members a little better and learn from one another.
Lotus Diagram: a structured brainstorming tool
I was in a pickle. It was nearly my Mom’s birthday, and despite looking for a gift for weeks, I had not found a worthy item. Luckily, before the big day, I learned of the Lotus Diagram—a tool for structured brainstorming. Using the framework, I came up with an outside-the-box gift that she loved! Since that initial success, I have frequently used the Lotus Diagram to select great gifts and formalize the brainstorming process in professional contexts.
What is a Lotus Diagram?
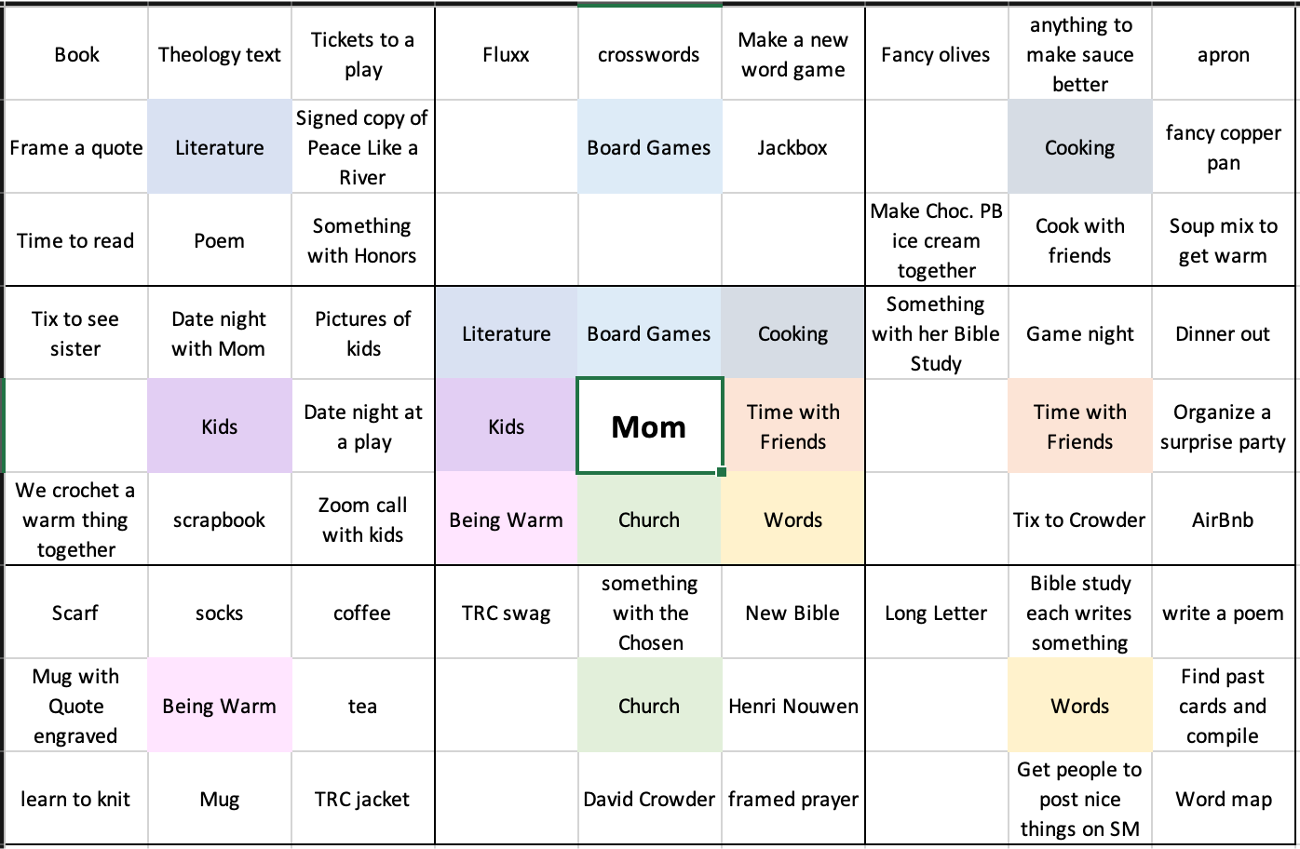
A Lotus Diagram is a 9x9 grid that moves from general to specific, where the center box contains the main idea. For example, while brainstorming my Mom’s birthday gift, I put her name in the middle.
Next, I filled the center box’s eight shaded spaces with categories related to the main idea (beginning with the top left and moving clockwise). I quickly identified three or four things my mom enjoys. This is where the magic of the Lotus set in. I was forced to think of eight unique ideas, pushing me beyond what was top of mind. As a result, my final categories were more abstract.

The final step repeats the process: each category becomes the center of its own 3x3 grid with specific ideas surrounding it. In this step, however, fixate less on filling all eight ideas. Instead, let the mind wander from block to block as it gets stuck. With this approach, we receive a second benefit of the Lotus: cross-pollination.
For example, I thought of a mug under the “being warm” category for my mom. Then under the “literature” category, I added “framing a quote”. I then realized I could combine ideas. Jumping back to the “being warm” grid, I added an idea for a mug with a quote engraved on it.
Within about 20 minutes, the Lotus Diagram can yield two or three ingenious ideas which combine elements from several categories. This year, I got my Mom tickets for a Mother-Son date to a local theater production of one of her favorite plays—hopefully, it’s a hit!
From presents to profession
The Lotus Diagram can also improve professional brainstorming. For example, incorporating this tool during dashboard development can lead to more successful designs. I recently built a recruiting dashboard. Initially, I met with the primary stakeholder to get an overview of the process and learn what success looks like. The meeting yielded a smattering of ideas, so I turned to the Lotus Diagram to organize our thoughts.
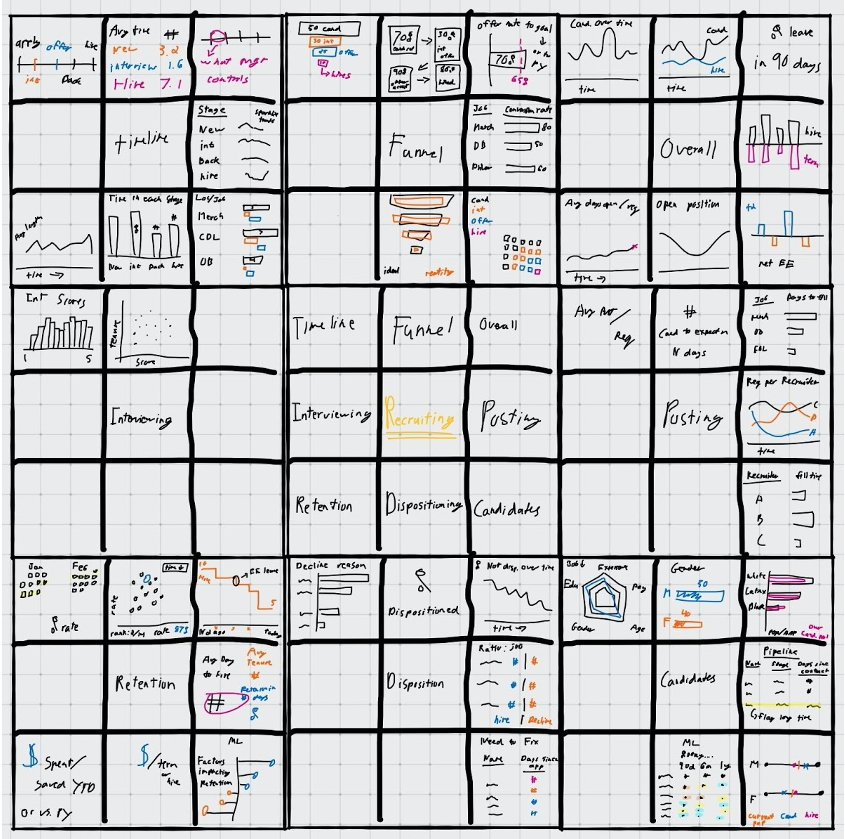
Working through the diagram helped me organize our ideas into eight main categories. From there, the exercise helped me to quickly generate several chart ideas ranging from ambitious (side-by-side Gantt charts) to elementary (BAN’s).
In my next meeting with the stakeholder, the Lotus helped her easily identify the two categories most crucial for her team, so we focused our efforts there. We then pulled together chart ideas from across the diagram (cross-pollination again!) to make an intuitive, actionable dashboard with insightful drill paths and interactions.
Expanding the Lotus
The Lotus Diagram can inspire insight in all sorts of situations. While preparing for a recent presentation sharing my company’s HR data journey, I used the Lotus to iterate through different narrative arcs. With my ideas structured, I found an opening twist to draw the audience into the story.
Lotus Diagrams can also work well when it comes to collaboration. When brainstorming ideas, each participant can complete two categories, or each member can fill one 3x3 grid. The Lotus is quite flexible; it is simple to tack on extra petals where needed or expand to fit the size of the group. With everyone responsible for a piece of the grid, teams see ideas from all members, not just the talkative folks.
One final feature of the Lotus Diagram, a favorite of mine, is that it indicates when to move from brainstorming to development. Using a Lotus not only ensures that we don’t skip the ideation stage, but also that we don’t get stuck in the brainstorming stage: once the boxes are filled, it is time to develop!
Lotus Diagrams are excellent tools for quick brainstorming. If you rarely have time to brainstorm in your work, this is a great option since it can be completed in about 20 minutes. If ideation is a natural part of your process, the Lotus Diagram can be an extra tool for combining ideas in new ways.
Low-tech planning and brainstorming are critical steps when building any sort of content—a report or a data-driven presentation. Consider how you might leverage the Lotus Diagram the next time you storyboard or conduct an analysis. To learn more from Gary, head over to the community and chat with him directly this month.
There are plenty of noteworthy members in the community—too many to spotlight at once. This program is part of our larger efforts to find new ways to share multiple voices and experiences. As you discover great work and ideas in the community, be sure to give appropriate kudos and spread the word!