don’t let your axis scales distort the story
One of the most common pitfalls in data visualization is manipulating axis scales in ways that distort the story. A frequent example is the use of logarithmic scales where they are not appropriate.
Let’s walk through a case where this choice can mislead, even if unintentionally.
At first glance, a strong relationship appears
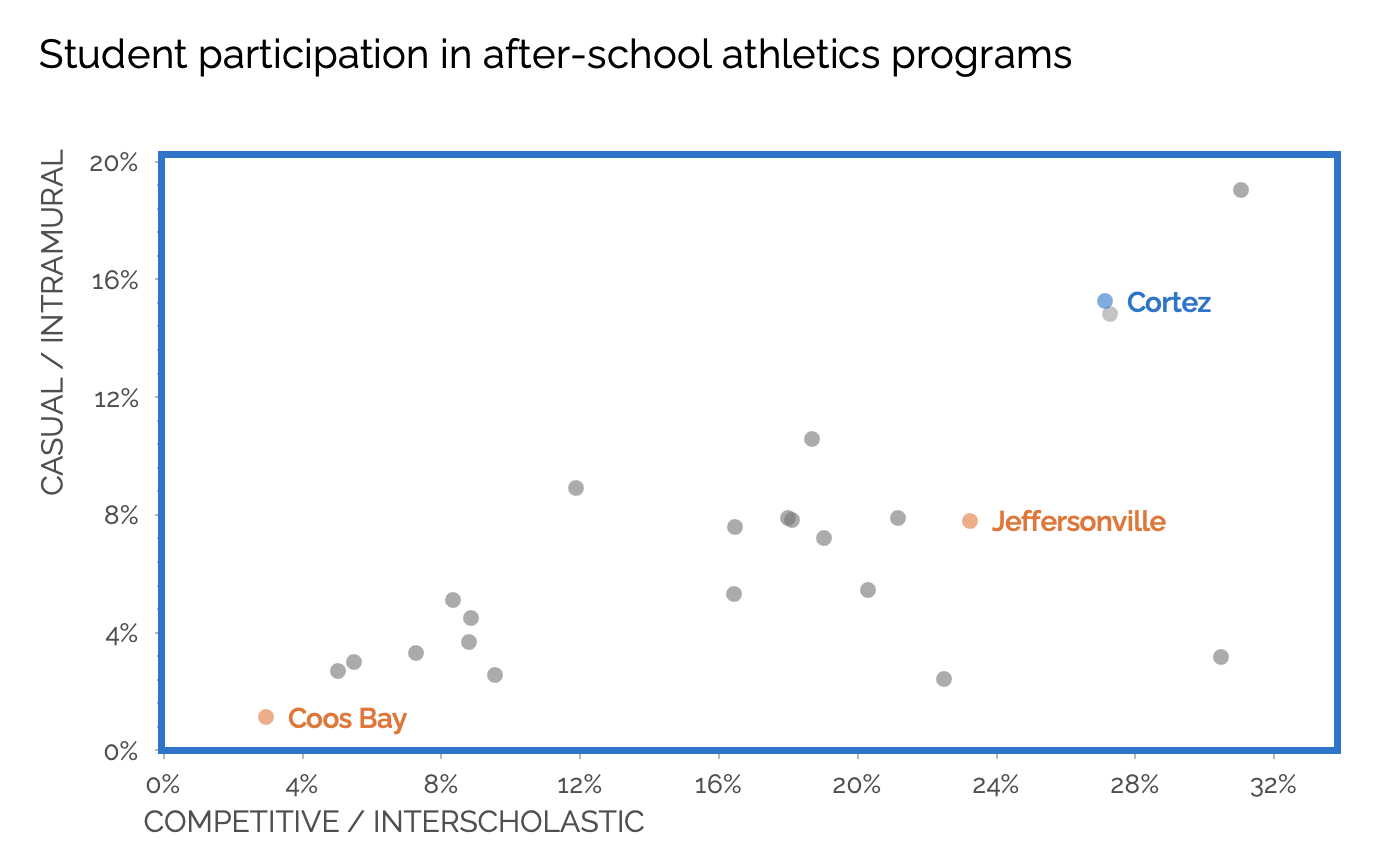
Below is a scatterplot showing student participation in after-school sports programs across a school district. Each dot represents one school.
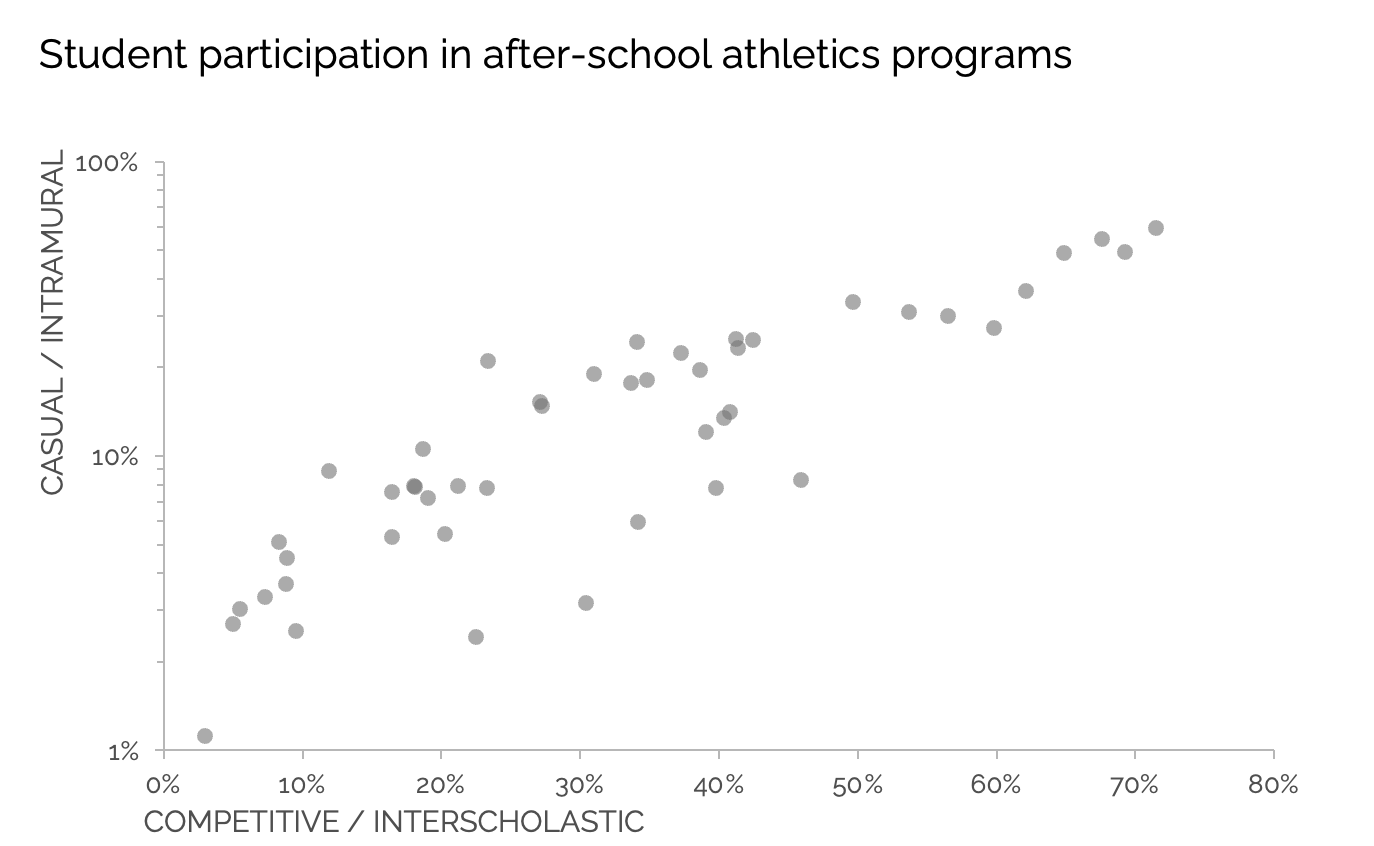
The horizontal axis shows the percentage of students participating in competitive (interscholastic) athletics. The vertical axis shows participation in casual (intramural) programs. At first glance, the data set seems to show a clear and linear upward trend: schools with more competitive participation tend to have more casual participation as well.
Let’s highlight a few individual schools for comparison.
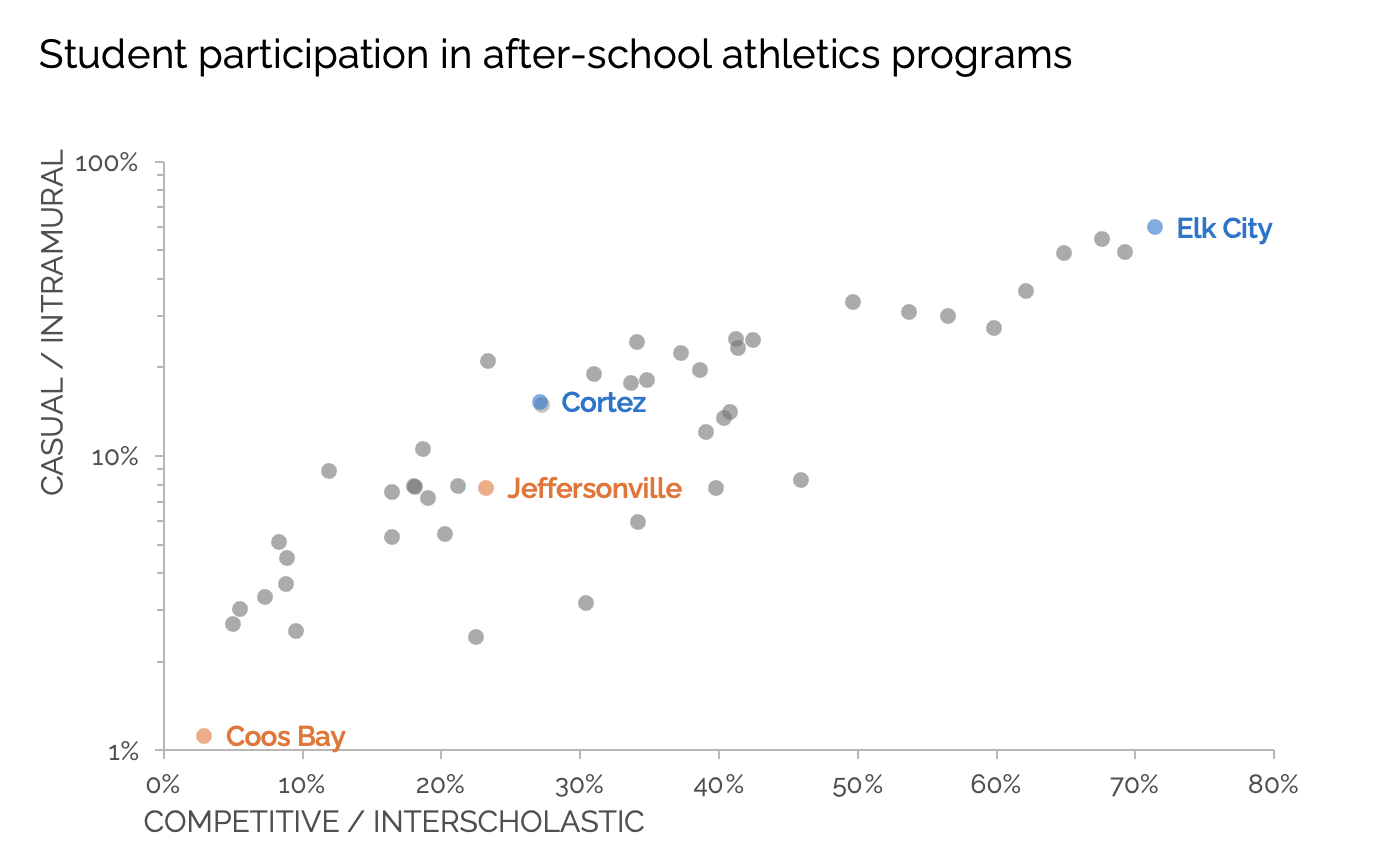
Imagine we’re trying to compare schools’ rates of casual participation, which is on the vertical axis. Coos Bay and Jeffersonville (marked and labeled in orange) appear to be quite different in their casual participation rates, while Jeffersonville and Cortez (which is in blue) seem more similar. This impression is shaped by the vertical axis being on a logarithmic scale.
How a log scale changes perception
On a standard axis, values increase by equal increments (for example, 10%, 20%, 30%). You can see that on the horizontal axis in the above graph, and in the vast majority of data visualizations we commonly see and use in business.
A logarithmic scale, on the other hand, increases geometrically (such as 1%, 10%, 100%). From a visual perception standpoint, this stretches out gaps between smaller values and compresses larger ones.
That difference matters. It alters how we perceive the distances between points.
Here is the exact same data, but with a standard, arithmetic scale on the vertical axis.
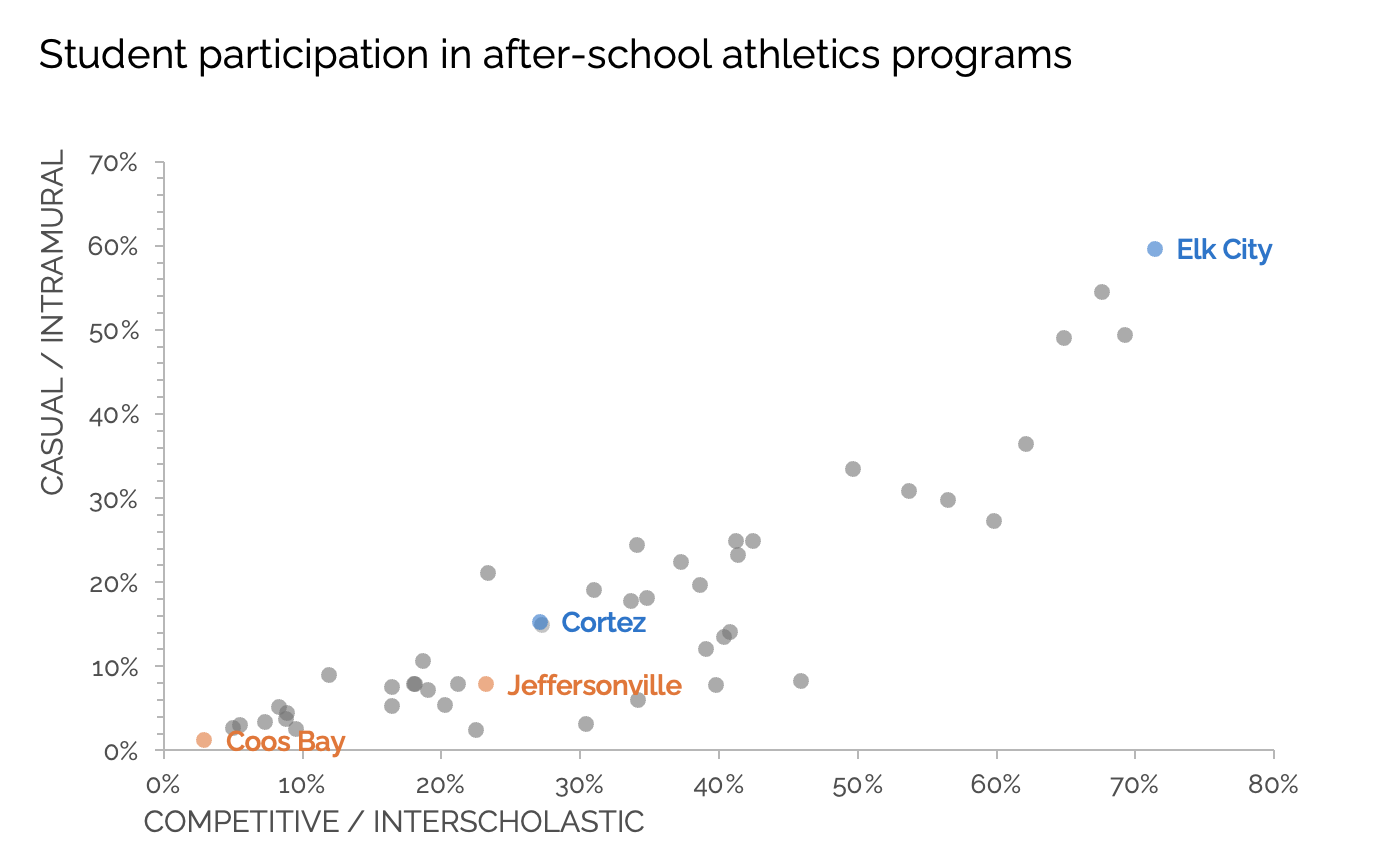
Now we can see that Cortez and Jeffersonville are not as close, vertically as they initially appeared. Elk City stands out as significantly higher than all others. This version more accurately reflects the data's true distribution.
When is a log scale appropriate?
To be clear, logarithmic scales are not inherently wrong. In fact, they are essential in some situations.
A log scale is appropriate when:
The data spans several orders of magnitude (e.g., from tens to millions)
The values grow exponentially, as with compound interest or viral spread
The focus is on relative rather than absolute change
For example, a chart showing the growth of confirmed cases in the early stages of a pandemic might use a log scale to better compare countries with vastly different totals. In financial data, log scales can help normalize trends across portfolios with different starting values.
However, when working with percentages that fall within a consistent range—such as 0% to 100%—a logarithmic scale can be misleading unless the data has a clear exponential pattern.
A better way to show small differences
So why use a log scale in the original example? Most often, it’s an attempt to make small values near the origin easier to distinguish. But manipulating the axis scale to make those differences more visible can distort the bigger picture.
If small values are important, a better approach is to zoom in intentionally.
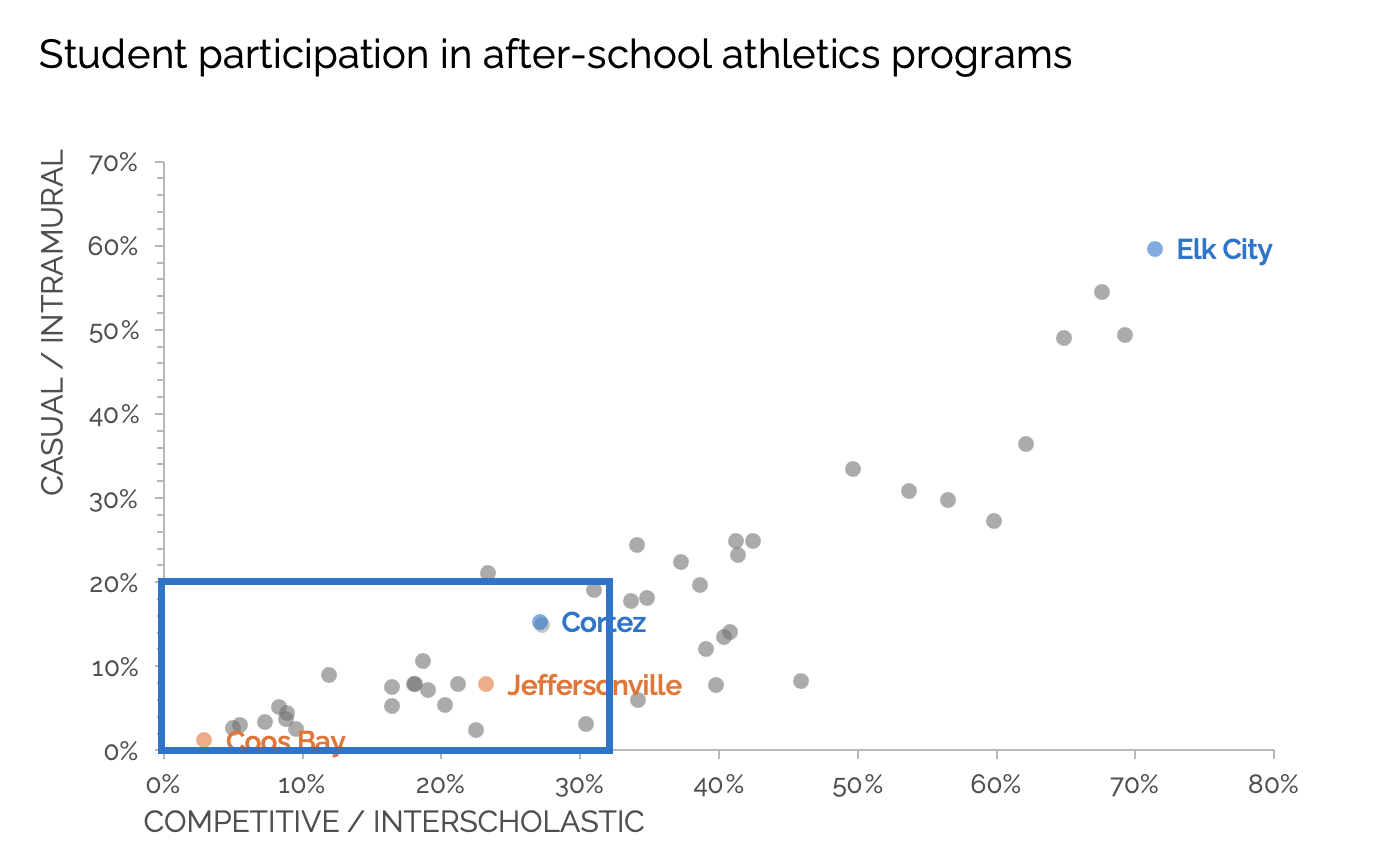
In this version, we highlight the lower-left corner of the plot and then show that region in its own focused view.
Now, the differences between Coos Bay, Jeffersonville, and Cortez are clearly visible, without changing the underlying scale. More importantly, we maintain an accurate sense of proportion across the full dataset.
Let the scale match the story
If your data does not have a logarithmic structure, avoid using a log scale as a visual shortcut. It can introduce confusion or mislead the viewer, even if the chart is technically accurate.
When small values matter, consider breaking them out into a secondary chart or zoomed-in view. Use your axes to reflect the nature of the data, not to force a certain look.
In short: let the data guide the scale, not the other way around.