what is a sankey diagram?

This article is part of our back-to-basics blog series called what is…?, where we’ll break down some common topics and questions posed to us. We’ve covered much of the content in previous posts, so this series allows us to bring together many disparate resources, creating a single source for your learning. We believe it’s important to take an occasional pulse on foundational knowledge, regardless of where you are in your learning journey. The success of many visualizations is dependent on a solid understanding of basic concepts. So whether you’re learning this for the first time, reading to reinforce core principles, or looking for resources to share with others—like our new comprehensive chart guide—please join us as we revisit and embrace the basics.
What is a Sankey diagram?
A Sankey diagram (also known as a Sankey graph or chart) is named after Captain Matthew Sankey, who created the diagram below in 1898 to demonstrate the energy efficiency of a steam engine:

In the image, you can see how Sankey used arrows to show the flow of energy with the widths of the shaded areas proportional to the amount of heat loss as it progresses through the engine’s cycle. This series of complex relationships would be difficult for a reader to understand at a glance were they simply presented in text and data tables. Making just such a sophisticated system easier to understand is the purpose of a Sankey diagram, which visually summarises the volume and direction of flows through the stages of a process or system.
Sankey diagrams have become common in science and engineering to visualise flows of energy and materials. More recently, their use has expanded to include more figurative applications, such as assessing the life-cycle of products or the progression of individuals through sales funnels or recruitment journeys, as shown here:

In this diagram, each stage of an organisation’s hiring process is represented by thin vertical rectangles (or nodes). The wider, curved bands connecting each of the stages are the flows (or links) which are sized proportionally to the quantitative values they represent. In this example we can see from the left-most node, there were 52 job applications at the start of the process. From there, candidates went in one of two directions: seven were selected to conduct a formal interview; while 45 were unsuccessful and categorised as “rejected.” From the seven who continued the process, only one applicant was offered a role within the company.
This is a simplified view of a hiring process. As we add in more steps at a greater level of detail, the Sankey diagram will provide a more sophisticated and informative view of where the recruitment effort could be improved.
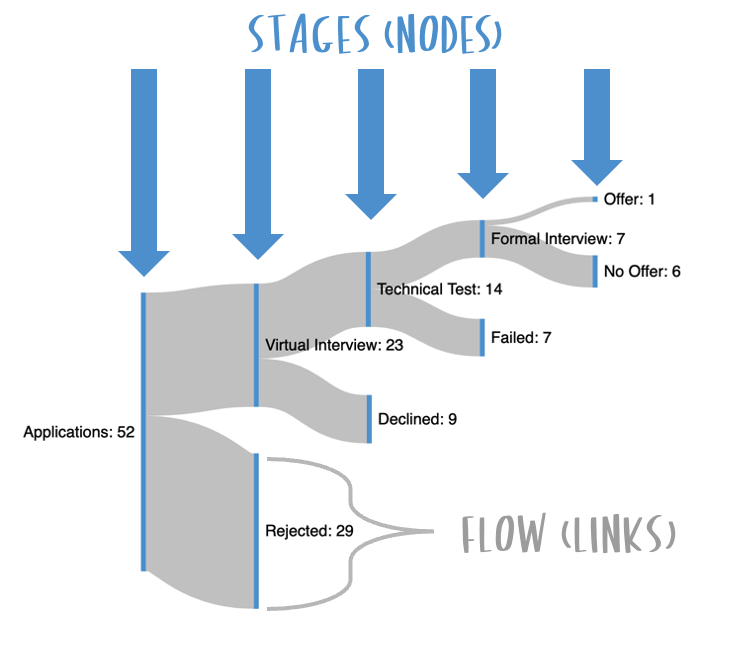
With this level of detail, we can now ask questions like “Are we taking too many applicants through to the virtual interview stage?” or “Is the technical test too challenging, given that only 50% of applicants pass it?”
This particular diagram is an example of process mapping: illustrating the steps in a process and the quantity of people, material, or information moving through them. This is useful in production workflows to identify waste and opportunities to optimise.
While process mapping is one use case for a Sankey diagram there are others, including:
Conversion funnels: Potential clients’ progress through stages of a sales pipeline or an e-commerce customer’s journey can be tracked through a Sankey diagram. This example, from SWD community member George-Alexandru Gavrilovici, highlights the stages of online shopping, from when a site is initially bookmarked through to a successful purchase. At each interim stage—added to cart, check-out and ordered—there is potential to cancel the purchase.

Resource and budget allocation: Track how valuable resources like time, budget, or personnel are distributed. Sankey diagrams can help highlight where these elements are overweight or spread thin. The diagram below depicts how a typical monthly household budget is apportioned. Individual income streams are pulled together before being allocated to essential expenditures of mortgage, utilities, children and food. What remains–disposable income–is utilised on savings and leisure activities.

What are some alternatives to a Sankey diagram?
When your data represents the progression of a flow through various stages, a Sankey diagram is perfectly appropriate. It’s not your only option, though. Other, similar chart types—often confused with Sankey diagrams— can also be used for different types of visual comparisons.
Parallel coordinate plots: Resembling a series of connected slopegraphs, parallel coordinate plots are used to display and explore multivariate data. Each data point within a series is joined by a line that spans across multiple vertical (and parallel) axes. Items on these axes represent a different category or dimension. This type of plot is particularly useful when you want to visualise and compare how different data series change together across multiple variables, but there is no specific order or flow across those dimensions.

In this example from Wikipedia analysing different measurable qualities of three species of the Iris flower, you can see each of the dimensions–Sepal Width and Length, and Petal Width and Length–are represented as a vertical line. Each individual flower gets its own horizontal line, coloured by species. You can see how the Virginica Iris (blue) typically has higher values for Sepal Length, Petal Width and Petal Length compared to the Setosa species (red) which records values for these same dimensions on the lower end of the scale.
Alluvial diagrams: A close relative of the Sankey diagram, the Alluvial diagram, named after the geological phenomenon alluvial fan, also displays flow across multiple stages but more commonly across time as opposed to stages in a process.
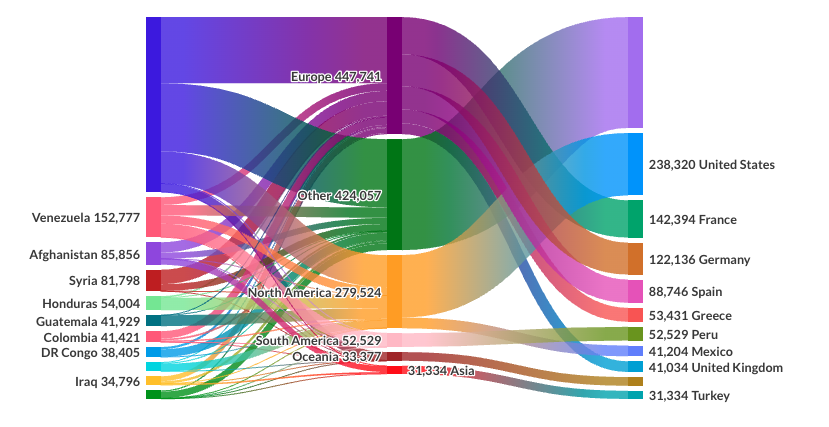
This example, created in the web-based tool Flourish, shows the migration journey from the country of origin on the left through the destination continent in the middle and finally the destination country on the right. While looking similar to a Sankey diagram the differences, albeit subtle, are important. Essentially this is a comparison of dimensions “How many people migrated from Venezuela to North America?” rather than a question of how elements are progressing through a defined process.
When shouldn’t you use a Sankey diagram?
We’ve discussed situations in which a Sankey diagram would be appropriate. However, be aware that under circumstances such as those below, a different visual or set of visuals (like bar charts, dot plots or line graphs) would be a better option:
Your data is categorical, but there is no inherent flow between categories.
When you have categorical data but there's no flow or transition between the categories, forcing them into a Sankey diagram would merely confuse your audience. It would imply a directional relationship between categories that didn’t exist in reality.
Precise comparisons need to be made.
Comparing the values of the flows by assessing their relative widths is challenging, especially in diagrams with multiple flows and stages. In most cases, labelling would be required to accurately understand the quantities, and that additional visual clutter would add to the audience’s cognitive burden.
They can be overwhelming to process.
While novel chart types like the Sankey diagram can be visually appealing, when presented with a combination of too many nodes, stages and overlapping flows this can be overwhelming to your audience. If, when reviewing your Sankey you find it difficult to discern any interesting themes due to the weight of information then consider whether a more common chart type might visualise the data more effectively.
What tools make Sankey diagrams?
For many tools, Sankey diagrams don’t come “out of the box” as a default chart option and therefore add-ins or additional (sometimes complex and time-consuming) creativity is required to create one. Strongly consider whether this additional effort is worth it, and research whether others have created templates in your chosen tool that would provide a useful starting point and eliminate the need to create one from scratch.
There are web-based solutions which allow the input of data to create a Sankey diagram. (Consider company data confidentiality when using these tools.)
Final thoughts
As with every chart type, ensure the Sankey diagram is selected for the right reasons. That is to say, ensure the visual fits the story and data supporting it, and don’t attempt to force the data into a sub-optimal chart selection or make this chart selection for personal or aesthetic reasons.
While Sankey diagrams are powerful for illustrating flows and the relationships between them, it's essential to consider the nature of your data, your audience's familiarity with the chart type, and the specific insights you want to convey before deciding to use them.
You can continue your journey through the rest of our “what is...?” chart series by browsing common visuals like bars and lines or by exploring our comprehensive chart guide page for additional graphs.