

#SWDchallenge: scatterplot!
October’s challenge is to create a scatterplot. We encourage you to make your scatters accessible with clear titling labeling and reference lines where appropriate. We also welcome the variations of connected scatterplots and bubblegraphs. Click for more details and examples!

September #SWDchallenge recap: MAKEOVER edition
We had a record participation in September with 96 people sharing their makeovers of the dual pie chart visual. Submissions ranged from slopegraphs to bar charts to dot plots and beyond. Click the link below to see the full recap post, including each submission and related commentary.

animating data
When presenting live, you have a ton of opportunity to build a graph or a story piece by piece for your audience. Check out the 90-second video in this post illustrating an example of how we do this at storytelling with data.
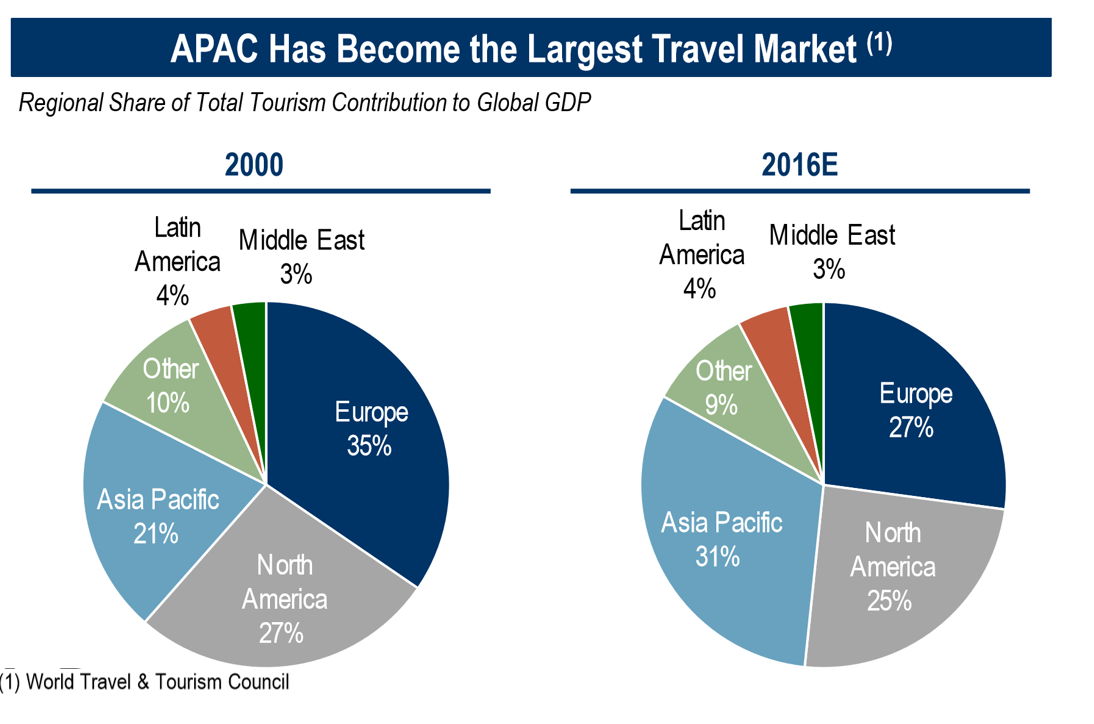
#SWDchallenge: how would YOU makeover this graph?
September's challenge was a slightly different flavor of the makeover theme: how would readers make over this dual pie chart visual? We challenged you to apply data storytelling best practices and a thoughtful critique in improving this visual. Expand the full post for more detail.

plots with dots!
More than 50 dot plots were shared in August, with many depicting point in time and group comparisons for topics in sports, pop culture, and a number of real world work examples. See a ton of varied design approaches and a deluge of dots!
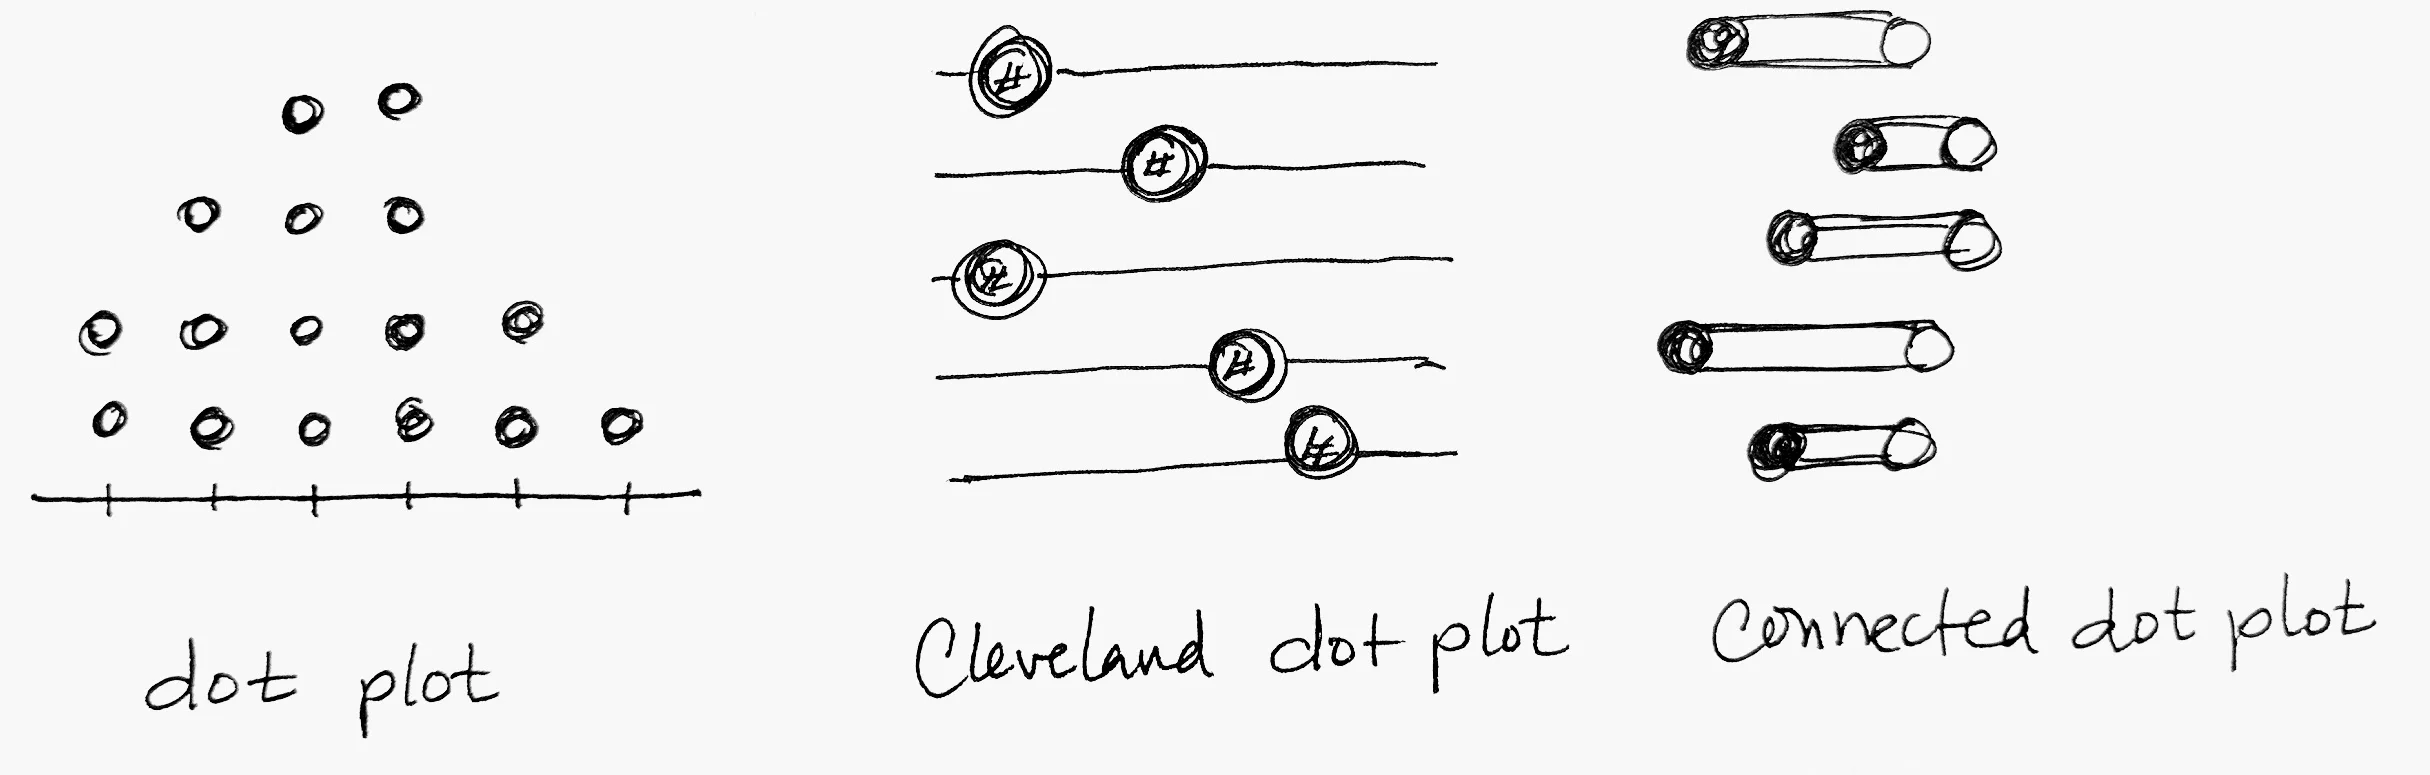
#SWDchallenge: let's plot with a dot!
The August challenge is to plot data with a dot… a dot plot! There are a few common types and this challenge is open to them all. Check out the full post for more details and an example.

#SWDchallenge recap: your choice makeover
45 people shared their makeover of a less-than-ideal graph, redesigning lines loaded with data markers and numbers, bars with non-zero baselines, bubble graphs, pie charts, a couple novel (and confusing!) radial views and more. Many of the redesigns made a clear point and focused through strategic use of color and words. This is a fun collection of before-and-afters!