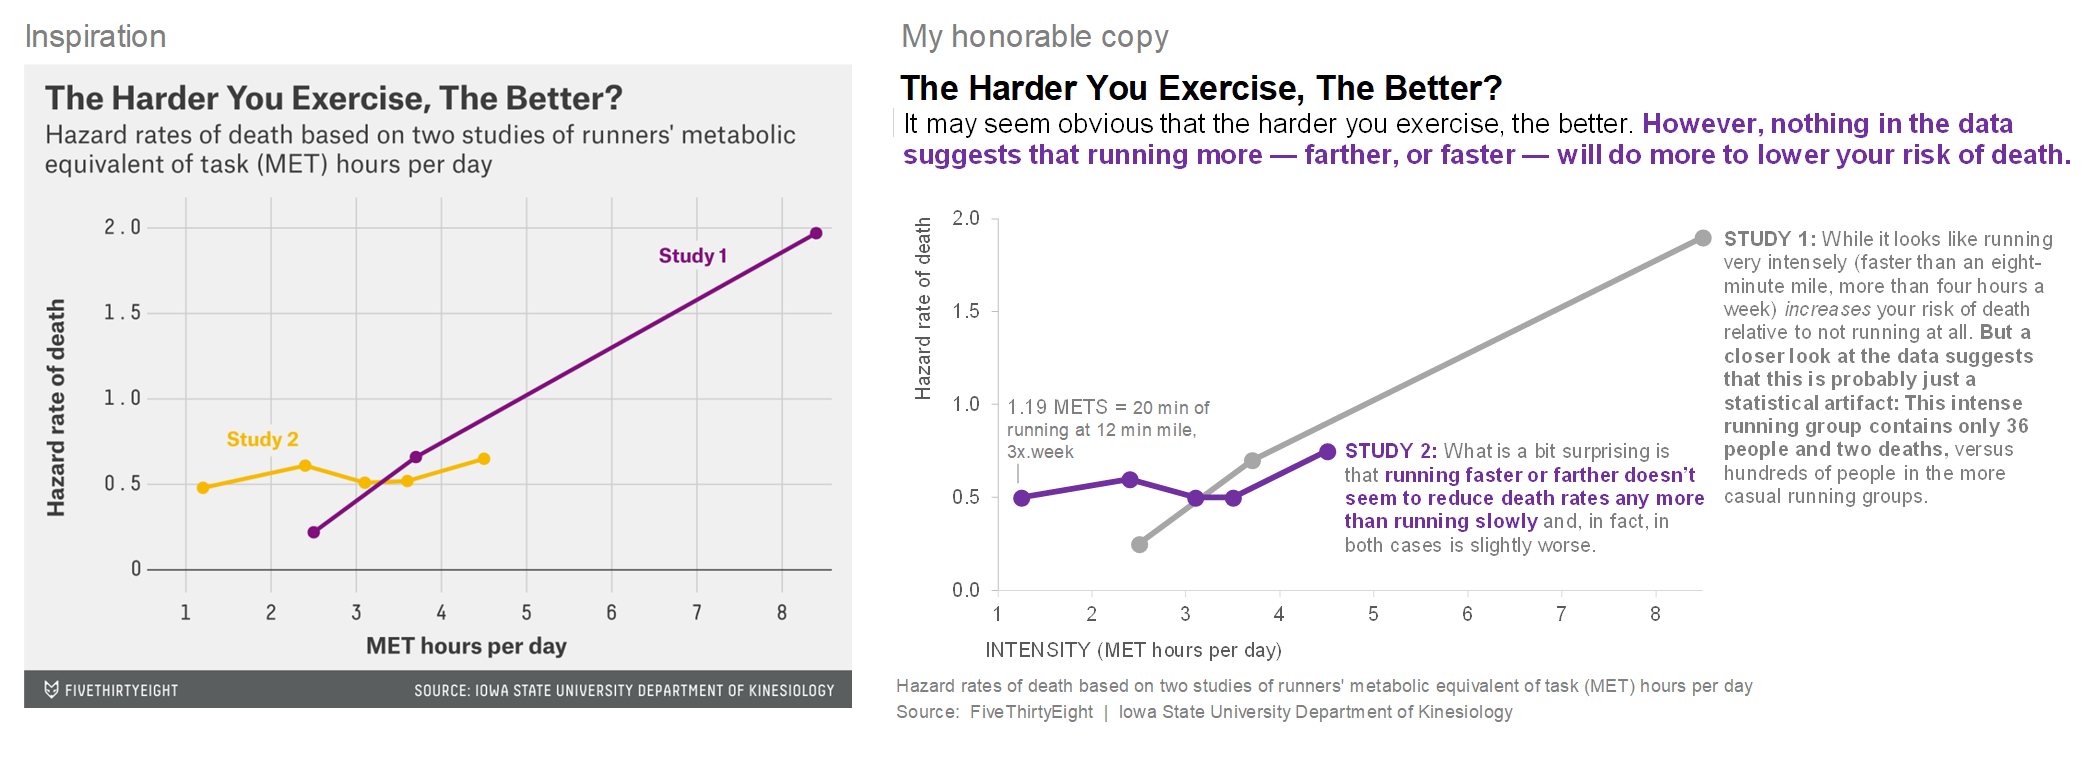
#SWDchallenge: emulate!
In this challenge, we pull from the premise of Austin Kleon’s book “Steal Like an Artist: 10 Things No One Told You About Being Creative” and challenge the community to emulate a visual they like in an effort to further hone data visualization skills and style. You can participate through 4/10—see full post for details!
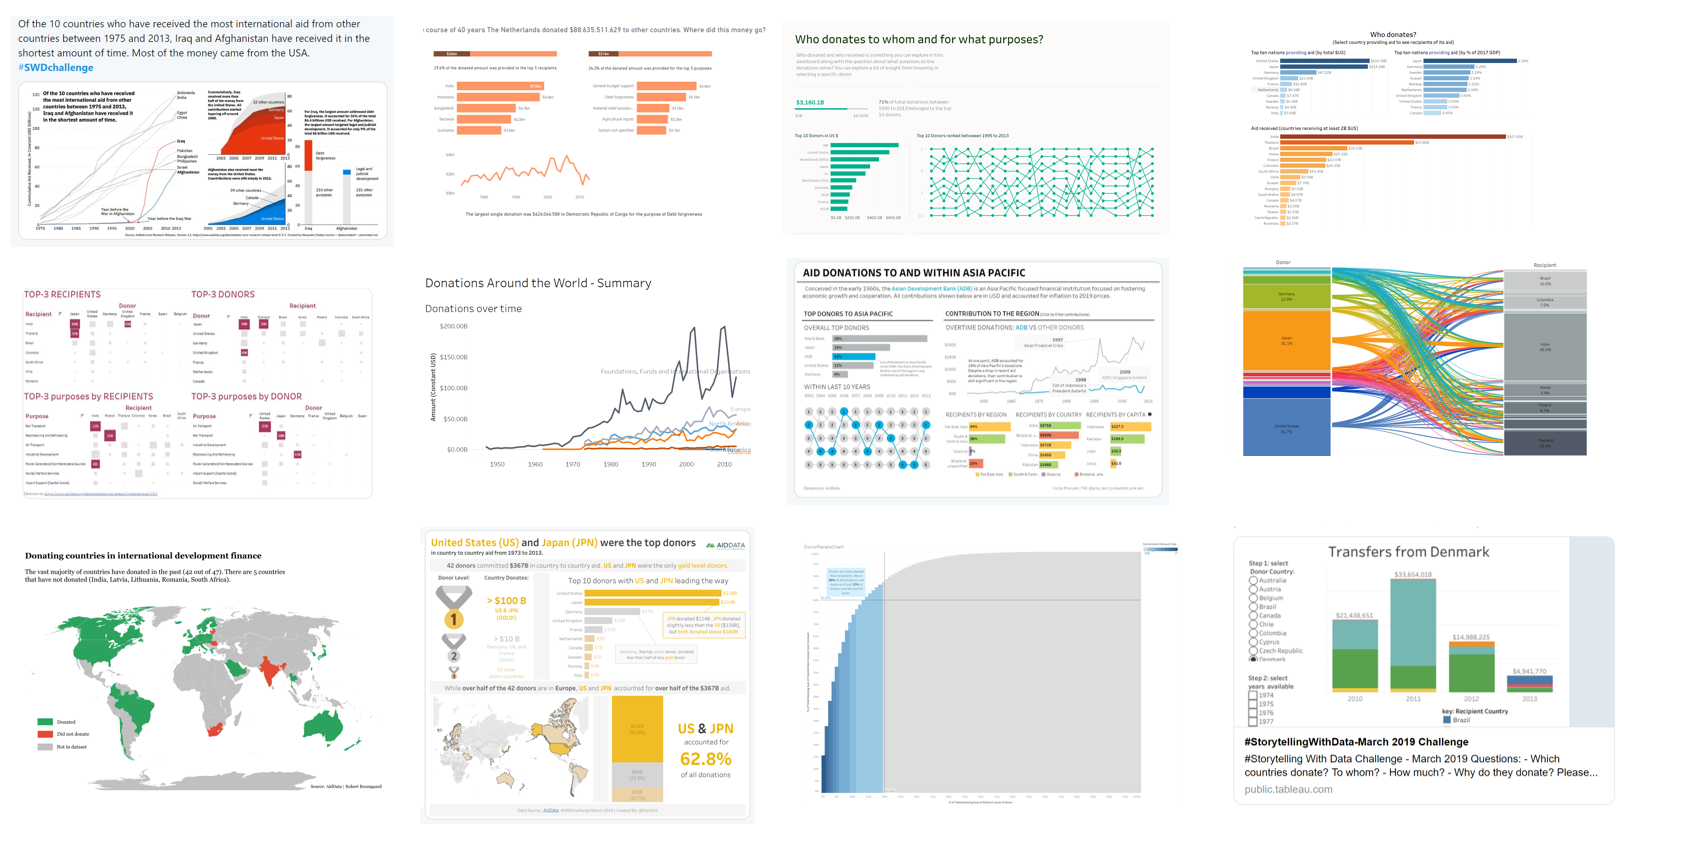
how YOU visualized it
69 different ways to visualize the same data! This underscores that in data visualization there isn’t a single “right” answer. Check out the full post to browse many ways to visualize AidData answering the question, “Who donates?” and more.
#SWDchallenge: visualize THIS data!
There is no single “right” way to graph data. Any data can be visualized multiple ways, and variant views of the data allow us to see different things. This month’s challenge is to see this in practice: we challenged our readers to show us how they’d visualize the same dataset.
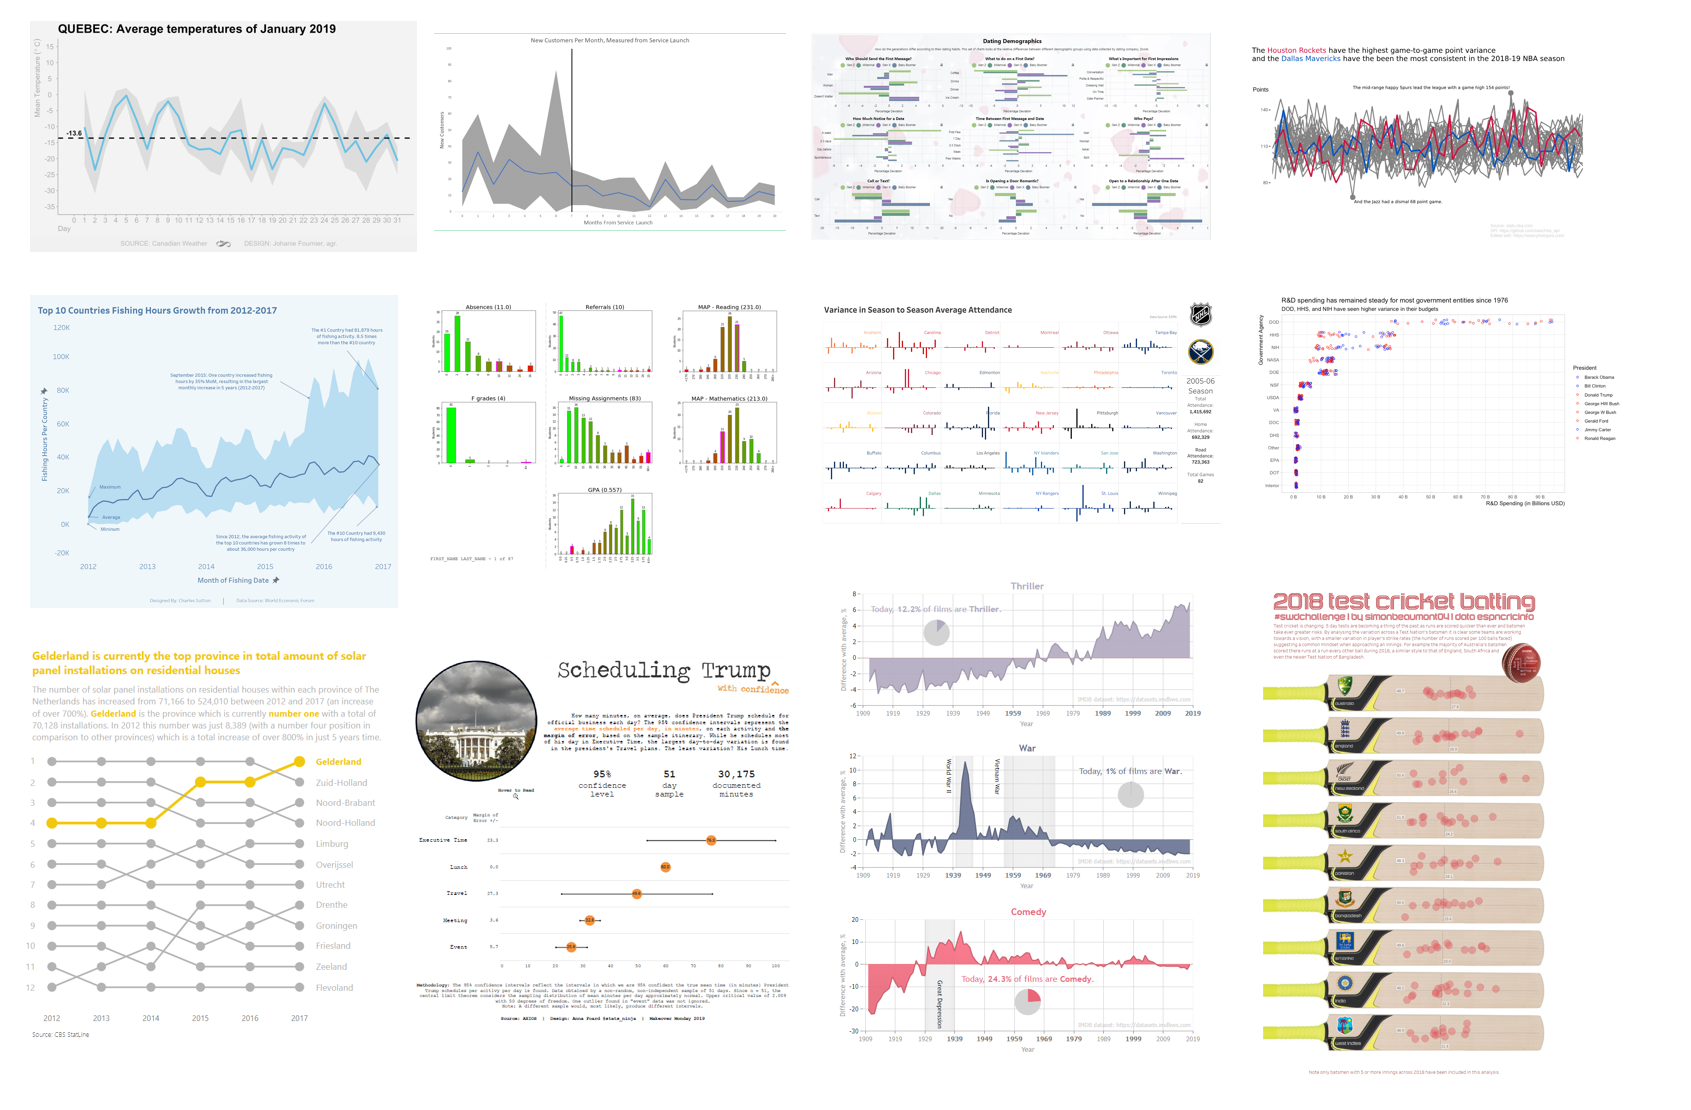
various views of variability
Wow, tons of variation in the ways people chose to display variability! Check out 41 visualizations of variability in data—featuring box plots, histograms, violins, reference bands and more—with topics ranging from weather to sports to love. Click to see the recap post that includes all the submissions.


#SWDchallenge: visualize variability
Is an average always the best way to summarize data? No! It can be useful to look at the underlying distribution of data and sometimes makes sense to show the variation. This month’s challenge is to visualize the variability in data. There are numerous ways to do so: the recap post this time around should be a good collection of approaches!