

designing in style
This month’s challenge was to re-brand a storytelling with data style graph in the style of your choosing. Fifty-eight readers submitted their re-designs with everything from McDonald’s to Vogue to Harry Potter and much, much more! Click to see the entire post and how effective brand can be when it’s thoughtfully incorporated into data storytelling.
#SWDchallenge: rebrand it!
Branding applied to data storytelling is much more than a specific font, logo or template color. Instead, thoughtfully incorporating aspects of an organization’s brand into the design of a graph can evoke a feeling or perhaps an emotional connection to the message the graph conveys. This month, readers were challenged to re-brand an example graph in a brand style of their choosing.
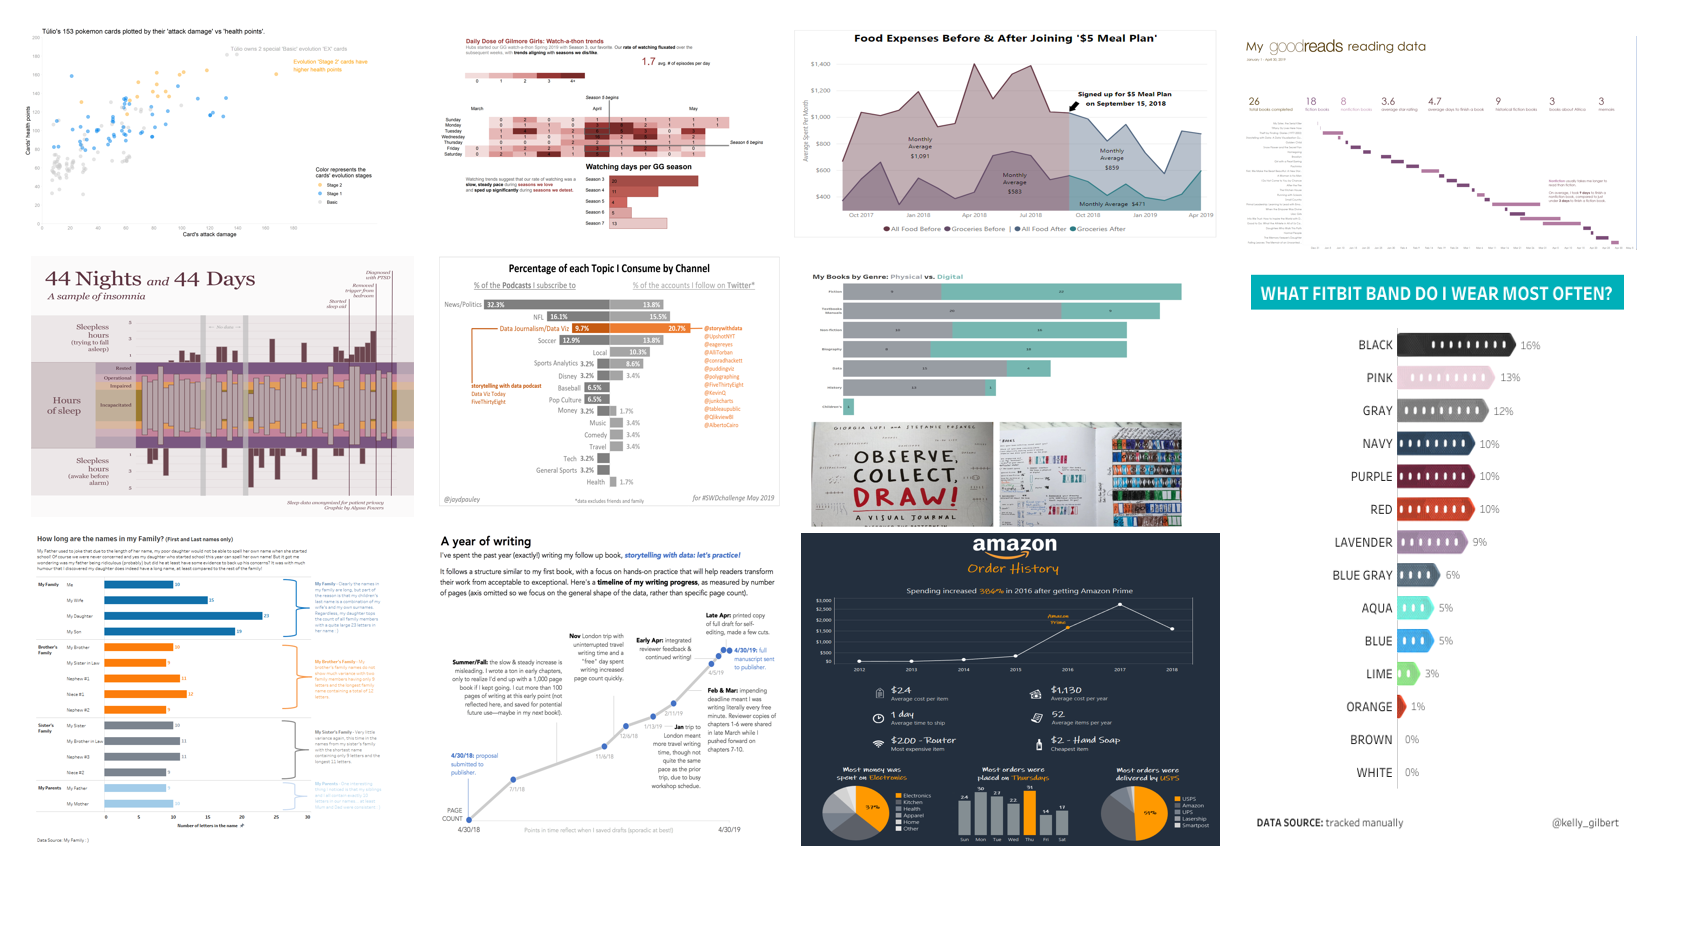
visualizing artisanal data
Fifty-three readers submitted visualizations created from their unique, bespoke datasets. By collecting and analyzing data that we own 100%, it allows us to identify and bring to light elements we know to be undoubtably true. Click the link to see the full post and be inspired to create and visualize your own artisanal data!
#SWDchallenge: artisanal data
If you collected the data, you cleaned the data, you made the choices, you know every reason behind every decision—you are perfectly positioned to analyze that dataset. May brings a guest challenge by Mike Cisneros: visualize data that you’ve curated yourself. Read the post for more details and an example.
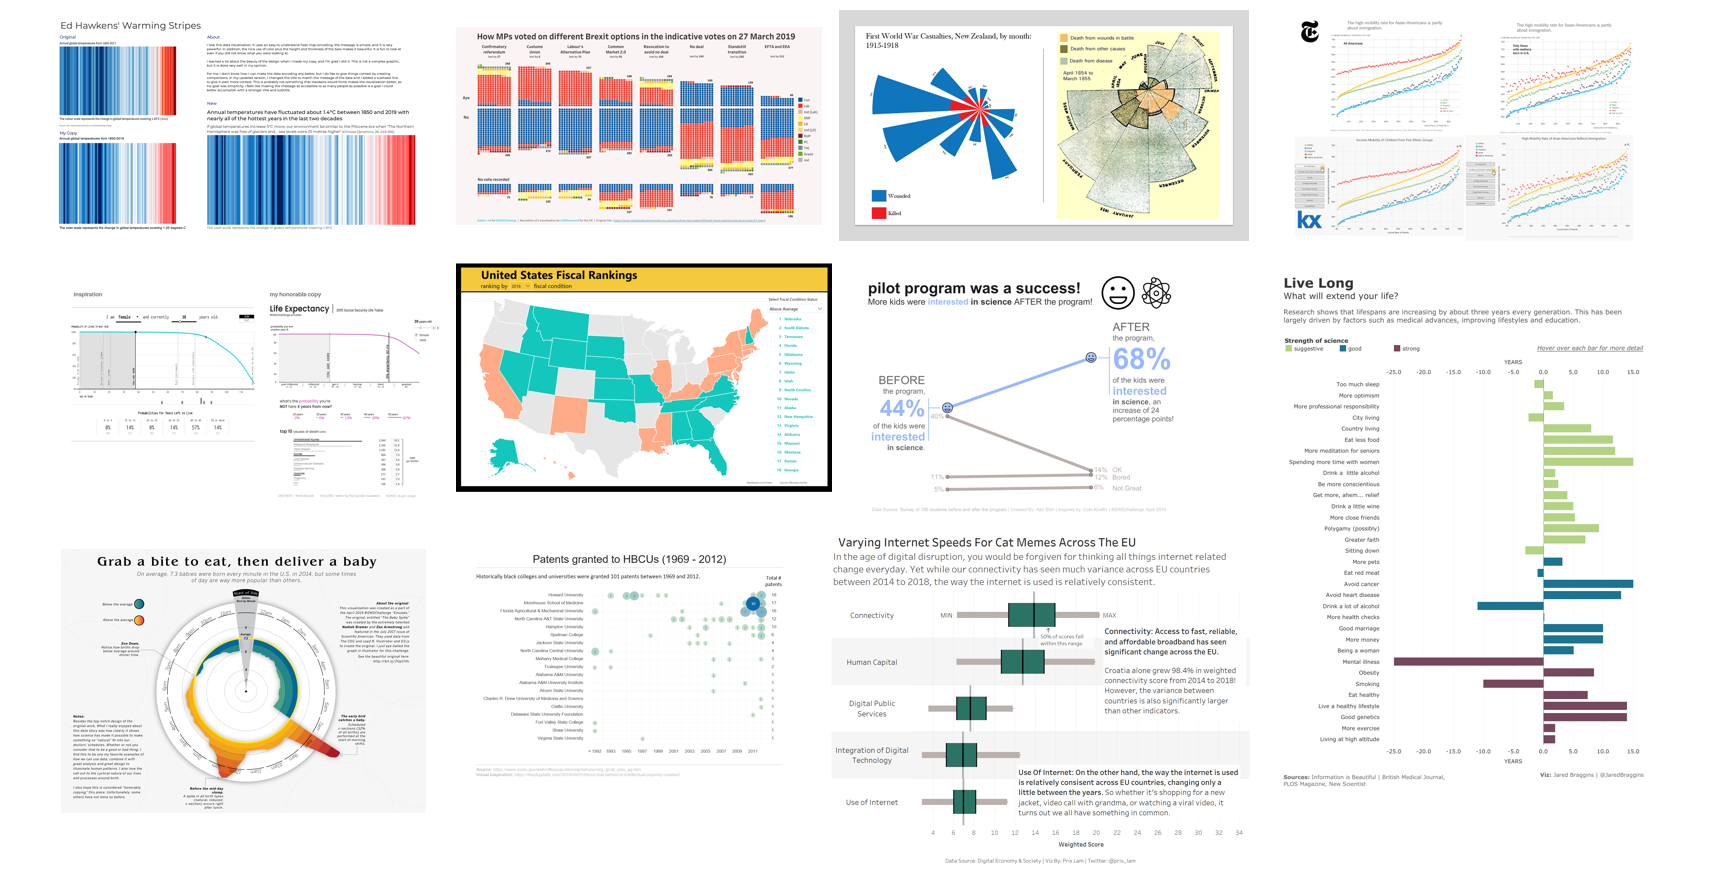
everyone's emulations
Fifty-four readers submitted emulations this month with sources of inspiration ranging from Minard to Nadieh Bremer to FiveThirtyEight and even storytelling with data. Click the link to see the full recap post, including each submission and related commentary.