
kaitlin henze, education and outreach specialist
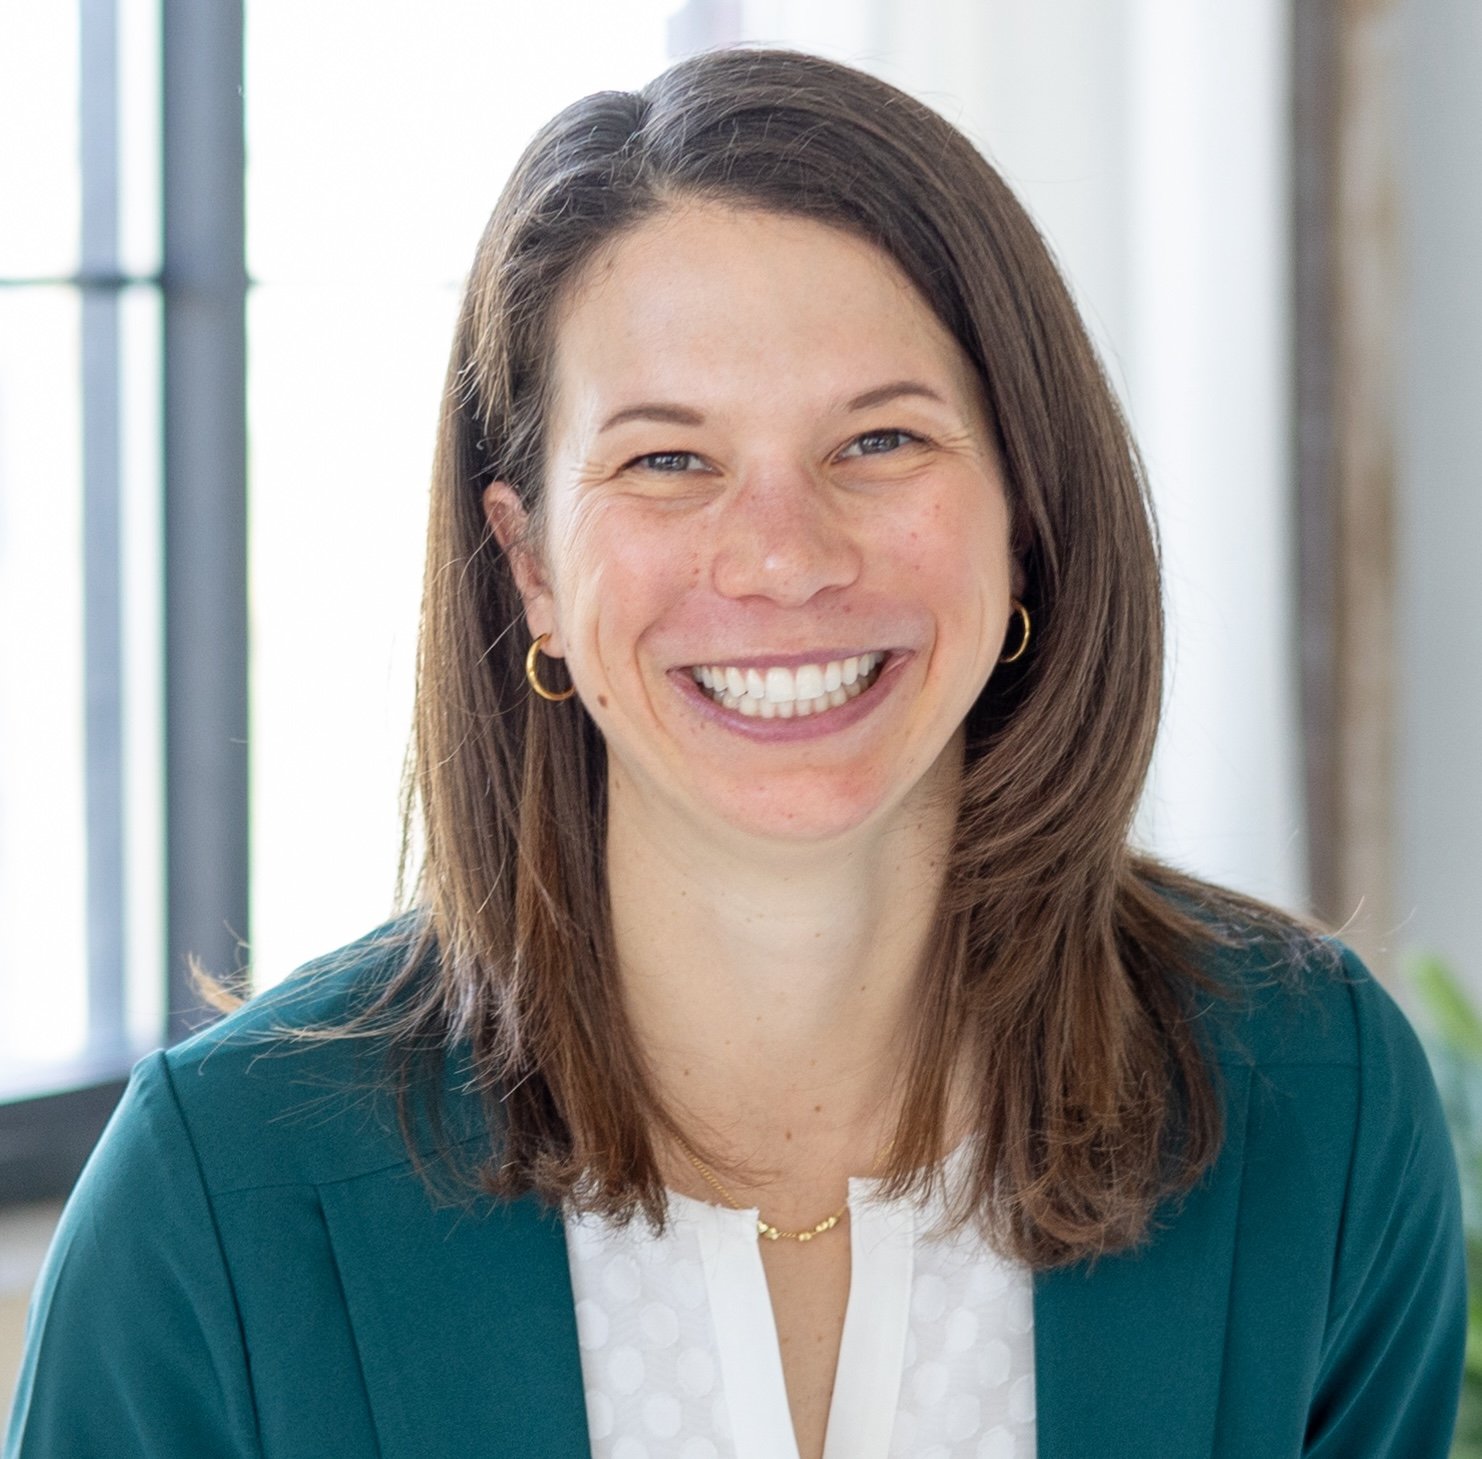
Specific focus areas: building a community, sharing resources, and developing partnerships with K-5 educators using Daphne Draws Data and university instructors using storytelling with data books.
Promotional materials
Need an official bio or photo of Kaitlin to help promote your session? Feel free to use the text and images linked below.
Official bio: click here (or scroll down)
Social media: LinkedIn
For web/mobile: lower resolution photo
For print: higher resolution photo
In their own words…
Where are you from?
I grew up in Northern California, moved across the country for college, and lived in 5 different states before settling in Milwaukee, Wisconsin, where I have now lived for over a decade.
Do you have a favorite chart type?
I love line graphs for revealing trends over time, making it easy to spot changes, compare patterns, and spark discussions while using past data to inform future predictions.
What inspired your interest in visualization?
I’ve always been passionate about empowering people to turn data into actionable insights. I first saw how powerful effective data visuals are in driving change through my work in nonprofits and human resources. That experience fuels my commitment to teaching data visualization to kids. Today, I help develop the next generation of data storytellers by facilitating programs, creating content, and building partnerships that expand access across the education space.
How do you spend your time outside of work?
I love being outside and enjoy long walks and time at the beach with my dog, or spending time in my garden. I also teach yoga and especially enjoy sharing mindfulness and movement practice with young adults.
Content
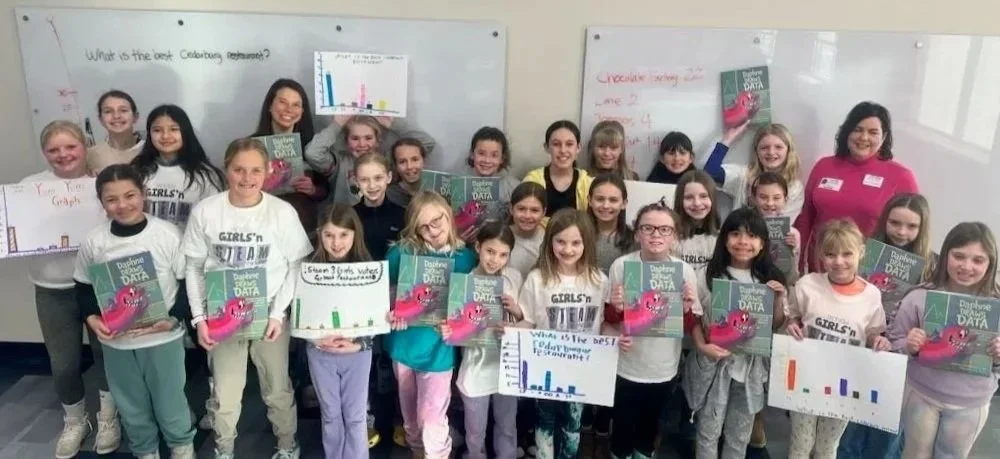
data storytelling isn’t only for grown ups
Learn how Daphne Draws Data is inspiring kids, supporting educators, and empowering volunteers to bring graphing adventures to communities around the world.
3 tips for graphing with kids
This video explains why drawing data is a superpower and provides three simple tips that you can apply when teaching kids how to graph at school, home, or as a fun after school club activity!
Official bio
Feel free to use or share this bio in any printed or promotional materials in support of your event.
Kaitlin manages educational initiatives at storytelling with data, supporting elementary educators and university instructors with resources to teach data storytelling in engaging ways. She builds strategic partnerships across elementary and higher education and connects educators with valuable learning resources. With a background in change management, business development, and strategic planning, she cultivates a global community of educators dedicated to equipping students with data communication skills. Kaitlin is passionate about fostering meaningful relationships and designing creative solutions that help shape the next generation of data-minded leaders.