SWDchallenge has moved into the community
As of November 2019, we’ve moved the SWDchallenge into our exciting new resource, the SWD community. We are no longer updating this page and will deprecate it completely soon. Please redirect any links to community.storytellingwithdata.com/challenges. Thanks and we hope to see you in the community!
The latest #SWDchallenge twitter chatter:
What is the #SWDchallenge?
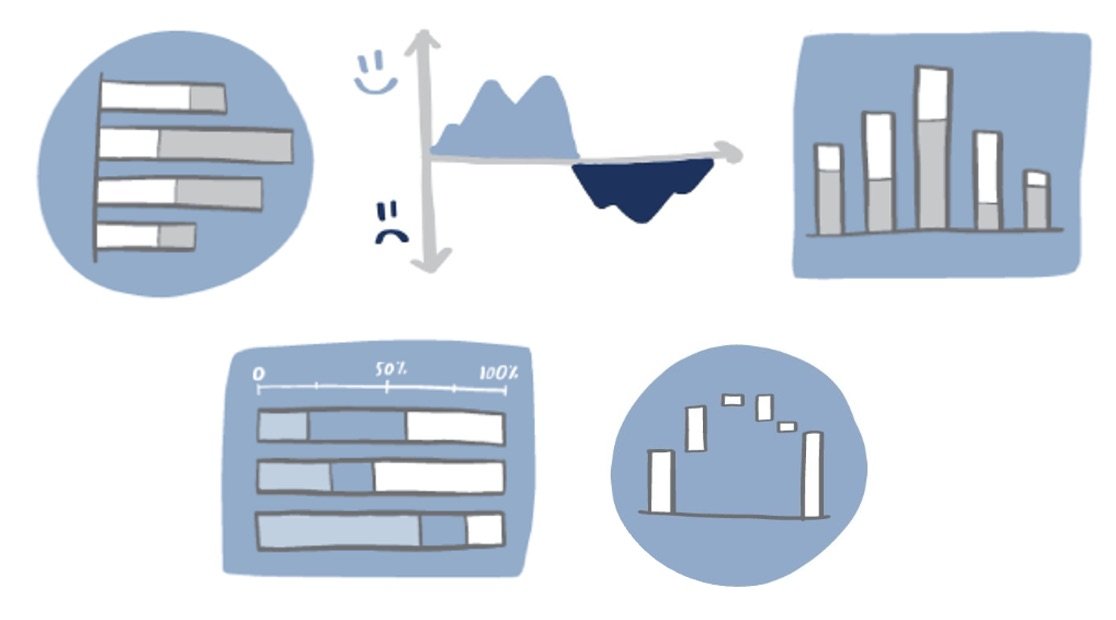
One of the best ways to learn is to do. The #SWDchallenge is a monthly challenge where you can practice and apply data visualization and storytelling skills. Think of this as a safe space to try something new: test out a new tool, technique, or approach. There’s no obligation—participate in one, a couple, or all. We encourage everyone to take part: all backgrounds, experience levels, and tools used are welcome. Each month has a different topic, announced at the beginning of the month. Participants have a week to find data, create and share their visual and related commentary. We're focusing currently mainly on different graph types, but sometimes change it up with a tip to try or specific topic. This is meant to be a fun reason to flex your skills and share your creations.
All submissions received by the deadline are shared back in a recap post later in the given month.
Browse the archives to learn & be inspired…
See below for past challenges and recap posts with readers' submissions. Be inspired by the many approaches and tools others have used to visualize and tell stories with their data!

Create and run your own #SWDchallenge at work! Check out how Simon Beaumont and team at JLL have created their own #SWDchallenge-inspired monthly data visualization challenge and are using it to sharpen their skills and share best practices across their organization.
Feeling inspired? Join us for the next #SWDchallenge to flex your data storytelling skills!


