Don’t just show data,
tell a story with it!
We teach people to create graphs that make sense and present compelling, action-inspiring stories
Learn storytelling with data—from the team who wrote the book on it!
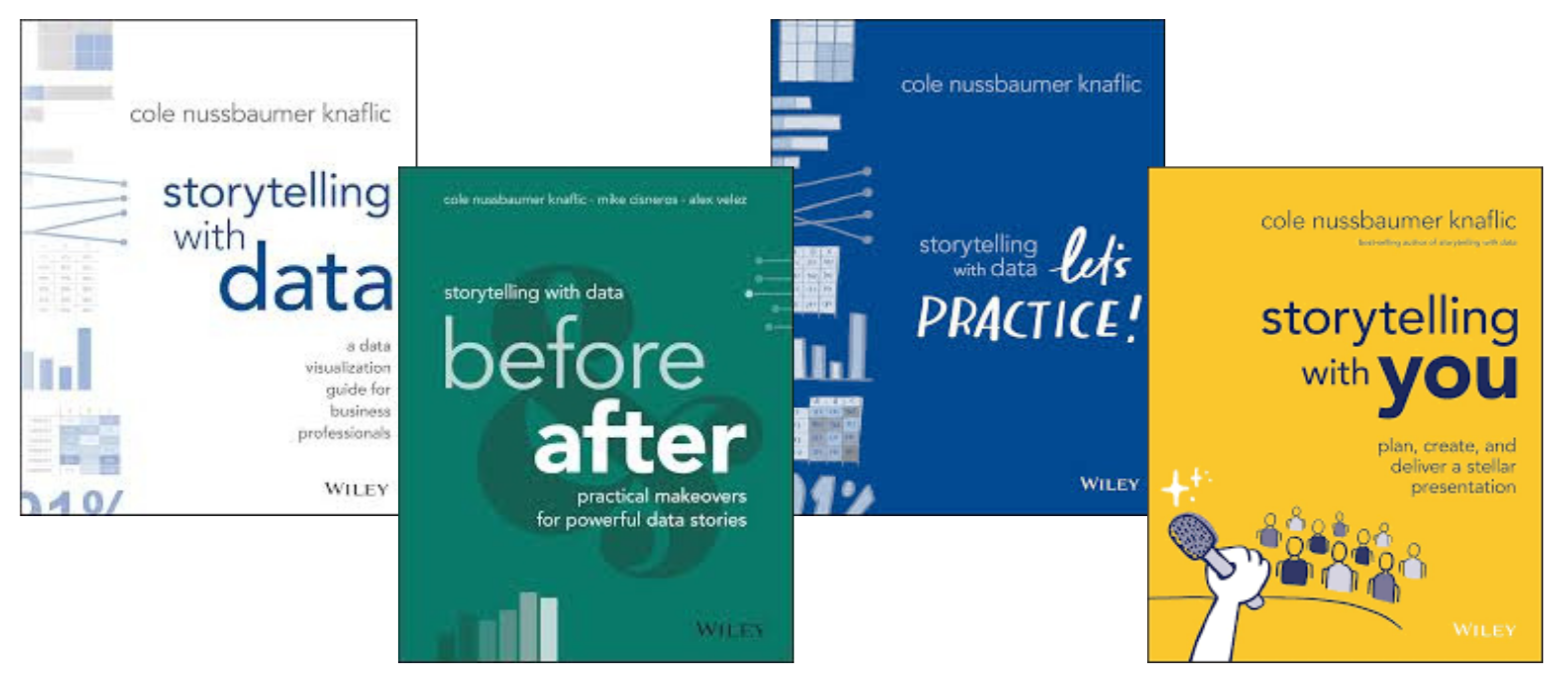
We teach a straightforward process to communicate data effectively based on the lessons in our best-selling books.
Get a feel for our teaching style by exploring our
graph and slide makeovers & learning videos.
We offer multiple options to develop your and your team’s data storytelling skills
Select from a range of virtual and on-site sessions—from short keynotes to full-day hands-on workshops. Our trainings are customized with examples from your organization and tailored to meet your data communication needs.
TEAM TRAININGS
Invest in yourself by attending a public workshop to develop your skills. You’ll meet individuals from a variety of roles and industries as you learn how to bring data to life and communicate a story confidently to an audience.
PUBLIC WORKSHOPS
Dedicate even more time to developing your data storytelling skills! Enroll in our in-depth 8-week course for a multi-media experience that combines lectures, reading, videos, podcasts, exercises, and a course project.
ONLINE COURSE
We have experience with all types of data from a variety of industries