let's practice!

I am incredibly excited to announce the upcoming publication of storytelling with data: Let’s Practice! It’s possible you’ve heard about it, as I’ve posted sporadically on social media and recently started discussing it during podcasts and events. I’ve been living and breathing the process of creating and refining it for so long that it was surprising to realize that here—on the blog—I’ve actually not yet written about this project!
So here’s where I change that and give you the inside scoop: who it’s for, what to expect, and some sneak peeks inside.
Like my first book, Let’s Practice! is written for anyone who needs to communicate data. If you’re reading these words now, this likely includes you. I am a strong believer that there are no “experts” in this space: we can all become increasingly nuanced in how we visualize data and weave it into stories to help someone understand something in a new way and drive action. The key to doing so is to practice, iterate, get feedback, iterate some more, and learn from each process. That’s where this book comes in.
Or, well, “not a book,” as we’ve been referring to it in official places. Because it’s really not just a book. Used right, it can foster an immersive learning experience through which you can become—or teach others to be—a powerful data storyteller. The first six chapters are aligned with the core lessons from the original book: (1) understand the context, (2) choose an effective visual, (3) identify and eliminate clutter, (4) draw attention, (5) think like a designer, and (6) tell a story. Each chapter contains three sections of exercises:
practice with Cole: exercises based on real-world examples posed for you to consider and solve, accompanied by detailed step-by-step illustration and explanation
practice on your own: more exercises and thought-provoking questions for you to work through individually without prescribed solutions
practice at work: thoughtful guidance and hands-on exercises for applying the lessons learned on the job, including practical instruction on when and how to solicit useful feedback and iterate to refine your work from acceptable to exceptional
These first six are followed by comprehensive chapters that pull everything together. Chapter 7 (“practice more with Cole”) contains full blown case studies that are posed and then solved to illustrate the holistic storytelling with data process. Chapter 8 (“practice more on your own”) contains similar but unsolved case studies (great for those teaching data storytelling to use directly or model after; more on this in an upcoming post). Chapter 9 (“practice more at work”) has guidance for applying the totality of lessons to projects faced on the job, plus facilitator guides, assessment rubrics, and more. Chapter 10 wraps everything up with some closing thoughts.
Each chapter begins with a short introduction of the topic, followed by a recap of the respective lesson from the first book. If you’ve read the first book, this recap will serve as a good reminder of the main topics. If you haven’t read the first book, there’s enough in the recap and exercises to fuel you. Catherine Madden worked magic, illustrating these recaps (among other elements throughout the book) in fantastic two-page spreads. Here’s an example from Chapter 5:

Chapter 5 SWD recap | Knaflic, Cole. Storytelling With Data: Let’s Practice! Wiley, © 2019.
Each chapter recap is followed by a sticky note summary of the exercises in the given chapter. For instance, here’s the outline for Chapter 2, which focuses on choosing an effective visual (plus a peek at Exercise 2.1!):
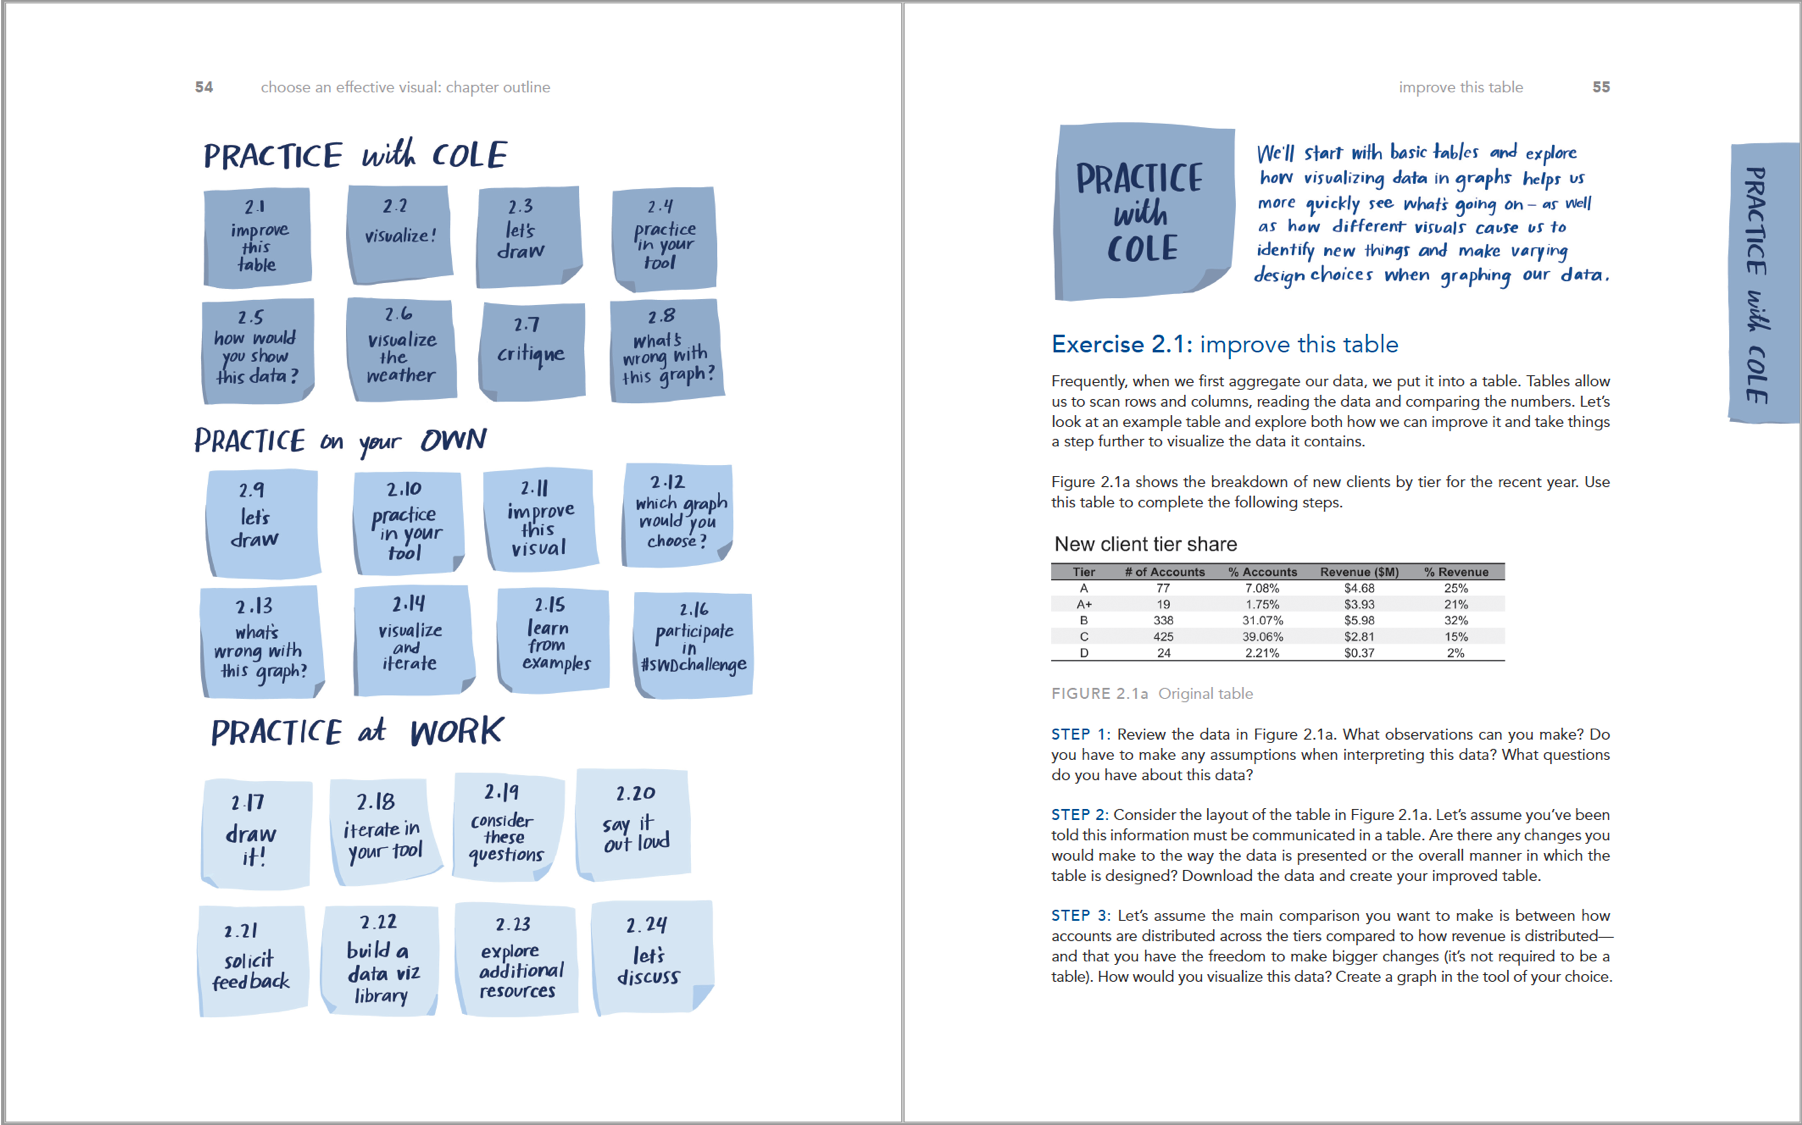
Chapter 2 outline | Knaflic, Cole. Storytelling With Data: Let’s Practice! Wiley, © 2019.
Much of the content was inspired by our storytelling with data workshops. One way this plays out is in the scenarios themselves. Because our workshops span many industries, so do the examples upon which I draw. Exercises navigate between different topics—from digital marketing to pet adoption to sales training—giving those reading and practicing a rich and varied set of situations to learn from while honing data storytelling skills. Another way this manifests is in the exercises themselves: they center around common questions raised and challenges faced that people communicate during or after a workshop.
For example, we sometimes get questions about using words together with graphs. Over time, I’ve encountered a ton of examples where this is not executed as well as it could be. Here’s the beginning of the solution to an exercise formulated to help individuals reflect on the many ways text and data can be visually connected:

Example partial solution | Knaflic, Cole. Storytelling With Data: Let’s Practice! Wiley, © 2019.
All of the data and graphs will be available for download. This means those practicing will have easy access to data to work with in the tool of their choice (the lessons themselves are tool-agnostic). Additionally, downloadable solutions (which will be provided in a number of tools) will be available for all practice with Cole exercises so those interested can both see what’s possible and the details of how they were created.
In total, Let’s Practice! contains more than 100 hands-on exercises and over 250 data visualizations. As you can imagine, putting words and graphs (and illustrations!) together on that scale was no small endeavor. Have you noticed how beautiful the 2-page spreads are above? Matt at Flight Design Co did tremendous work in this area, laying out the actual book (and being patient through multiple iterations in our collective attempt to make it perfect).
Numerous others helped behind the scenes, reviewing drafts, editing, providing feedback, and helping in all sorts of ways that we tend to overlook when we hold a book in our hands. I won’t overlook it with this project; I am extremely grateful to everyone who contributed. And I’m very excited to soon share it with you. There is a ton of value to be obtained by analytical work that is already being done that simply isn’t being communicated as effectively as it could be—I hope this book is another step towards changing that.
You’ll be seeing additional posts from us on topics related to the book in the coming weeks leading up to official October publication, so please stay tuned. I’d love for you to preorder your copy today (Amazon, B&N, BAM!, Porchlight, Wiley, or even better: place an order at your favorite local bookstore) and spread the word to others who will benefit from effective data storytelling!