three tips for storytelling with qualitative data
Typically we hear the word “data” and think of numbers and statistics: metrics that can be directly measured, summarized or tracked over time such as sales, expenses or headcount. In some cases, however, the data we’re analyzing is qualitative in nature: data that’s not structured, for example customer sentiment, opinions or consumer behavior. I recently conducted a client workshop with a group of user experience researchers at a tech company. This team was researching users’ behavior with their product and collecting highly unstructured data about opinions. The question arose: how might the storytelling with data principles apply when communicating with both their quantitative and qualitative data?
In today’s post, I’ll outline a few tips for effectively communicating with qualitative data using an illustrative example. These tips only scratch the surface on this topic—we’ll be curious to hear what others have done in similar cases!
the use cases for qualitative and quantitative data
Let’s briefly expand on the difference between these two data types: we’ll use customers as a variable of interest. Qualitative data on customers might include sentiment, opinions or characteristics and could be unstructured, free text collected through surveys, interviews or observations about their shopping behaviors. Quantitative data on customers could include average transaction count, sales history or propensity to buy a particular product, measured by numbers, demographics and statistics. One isn’t “better” than the other and often these two data types go hand-in-hand. You might use qualitative research to identify a problem—such as negative opinions on customer service—and then use quantitative measures to analyze the problem—how prevalent it is across different customer segments, how opinions change over time, or how negative opinions might correlate to sales. The reverse also holds true: quantitative data might bring an issue to light (such as transactions declining) and then you might use qualitative measures (i.e. voice of customer data) to add further context for the audience.
an example: storytelling with quantitative data
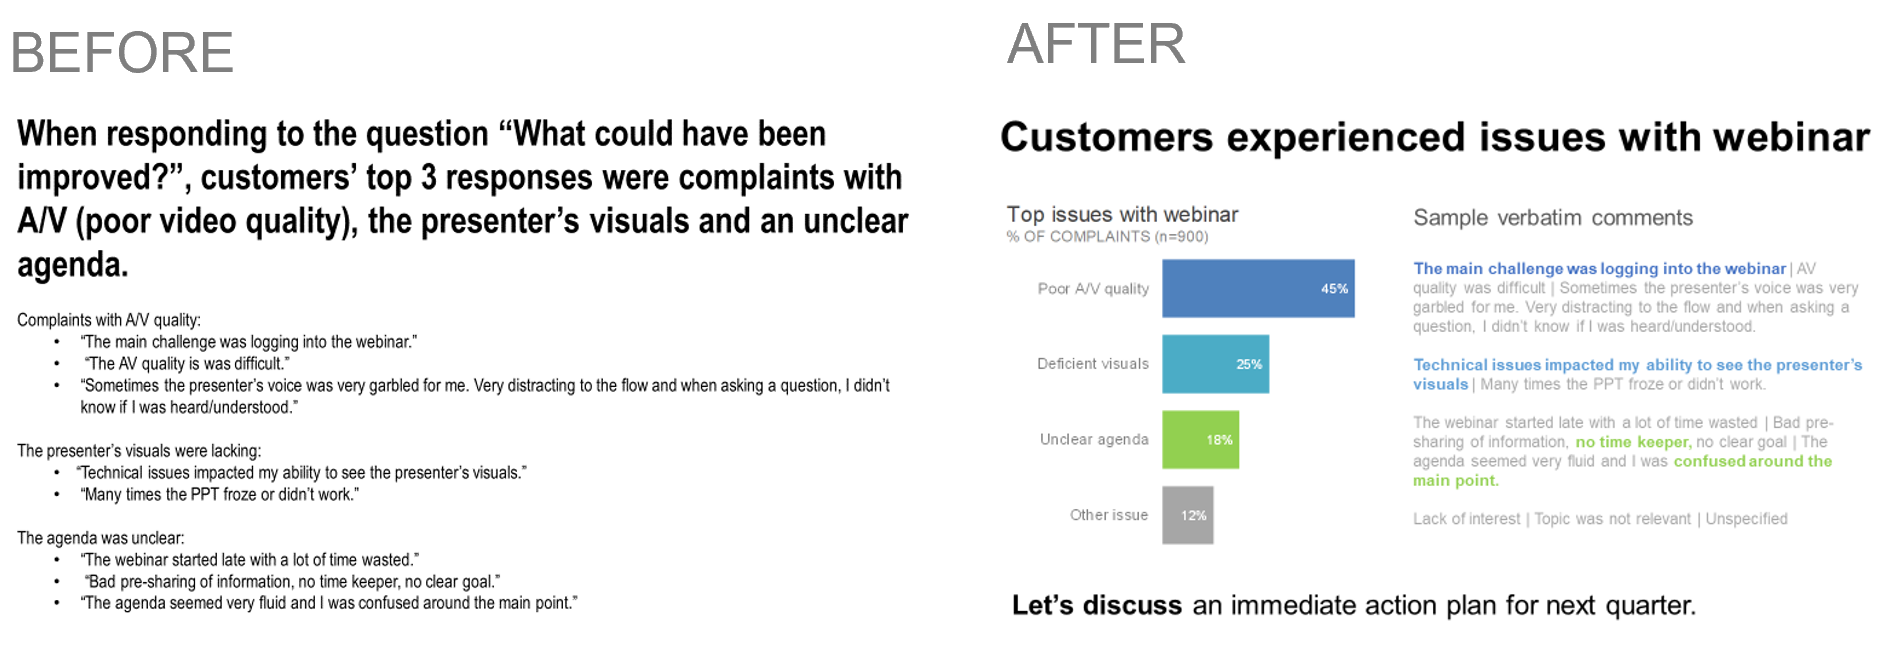
Let’s revisit the question of applying storytelling with data principles to qualitative data. Imagine your organization recently held a webinar for prospective customers and you’ve been tasked with collecting attendees’ feedback and reporting results to management. While you might collect some quantitative data—attendance rate, participation rate, and length of time attendees listened to the webinar—you’re also interested in qualitative metrics such as their impressions of the presenter, what topics they most enjoyed and overall feedback. You’ve conducted a free text survey and you’ve outlined some findings with verbatim comments in your PowerPoint deck to management, as shown below:

We’ll use this example to revisit the the client’s question. Here are three ways we can move beyond simply showing qualitative data:
Use color to draw the audience’s attention to the most important aspects.
Reduce the amount of text: pithier, more concise wording will help the audience process the information more efficiently.
Evaluate the audience’s needs: consider quantifying the data if doing so provides important context.
The power of color:
To illustrate, check out the difference between how you process these two blocks of text:

In the image on the right, I’ve used color sparingly to draw attention to the top three customer concerns. When used sparingly and strategically, color is one of the best tools we have for focusing our audience’s attention (for more examples, check out the video in this historical post). I’ve also used another pre-attentive attribute—font size—to create a visual hierarchy of information, helping indicate to the audience where to look first (this is most important!), where to look second (this is next most important), and so forth.
More concise wording:
Notice the effect of using pithier, more concise wording. I reduced the very wordy original title (“When asked what could have been improved….”) into a new main title and related subtitles:
The main title became “Top 3 customer concerns” with the survey question de-emphasized below it. It’s there for reference but not the main focus of the title.
The subtitles became “Poor AV quality, Deficient visuals, Unclear agenda”, using less words while still getting the original points across.
Studies have shown when people first glance at something, they spend about three to eight seconds deciding whether they’ll continue reading or move on. Even if I only get that first three seconds, the main message isn’t lost if I’ve provided scannable, concise wording.
Consider quantifying the data:
Let’s consider the audience’s needs: can we provide important context by quantifying the data?
Even this data is qualitative when it was collected, it’s likely that we do have some qualitative measures around it (or can pretty easily tabulate it). For example, how many respondents complained about A/V quality? Was it 80%? 5%? You can imagine how this context might make a difference when considering subsequent action. For example, the IT team tasked with improving A/V quality would need to know if this was a widespread problem (80% of users had issues) or an isolated problem (5% of users) and how they might take very different actions based on this information.
The visual below shows how I might quantify the data: on the left side, I’ve included a horizontal bar chart showing the top three responses as a % of the total responses to this survey question. On the right hand side, I’ve included the verbatim comments directly next to the issue they describe.

pulling it all together
Finally, check out the effect of applying all three tips: applying color, reducing text and quantifying:

Paired with a takeaway title and call to action, we’ve moved beyond simply showing data to using it to incite action. You can download the file to see how I created the final graph in Excel. For more examples of communicating with qualitative data, check out these historical posts:
In summary, when communicating with qualitative measures, consider how effective these three tactics are in making your communication more impactful to your audience.
For more ways to build your data storytelling muscles, join the SWD community.