member spotlight: Charles Saulnier

The following is a guest post from Charles Saulnier. Charles completed every #SWDchallenge last year—a rare achievement! To see examples of Charles’ creations, check out his community gallery and follow him on Twitter. Keep reading to learn about how Charles brought the #SWDchallenge to work—establishing a data viz community of practice with his colleagues. Don’t forget to pop over to the community to chat with him directly as part of our latest Member Spotlight.
Each month, we select someone from the community to highlight through our Member Spotlight. These are people who contribute in ways that foster an even more connected and diverse learning environment. Our goal is to help you get to know your fellow community members a little better and learn from one another.
A data visualization community of practice (at work)
Last month, I was shocked when I saw the topic of the January SWD Challenge: visual resumes. Why? Because we had come up with the exact same challenge for our small DataViz community of practice (COP) at work!!! And yes, we had advertised it first (well, during a meeting anyway).
Cosmic coincidences aside, I want to use this opportunity to share my experience building a DataViz COP, and maybe spark a conversation about the benefits and challenges.
Before I get to the main topic, let me quickly introduce myself. I currently work as a Data Analytics Manager at Larochelle Groupe Conseil, a consulting firm based in Montréal (Canada). While I have been working in analytics for eight years, I only started doing data visualization about four years ago. I attended a class on dashboarding and decisional computer science, which made me realize that there is so much (still) to learn about communicating effectively with data. That is also the moment Cole and storytelling with data’s work got on my radar. They’ve been shaping my journey ever since!
The beginnings of a data visualization community of practice
As I read and started to get involved with the SWD challenges, I thought: “This is amazing! Surely, there is value (and maybe a business opportunity) for Larochelle to improve our design skills.” The benefits of communities of practice are well documented and include increased team building, shared knowledge, and employee engagement, to name a few. If you’re interested in learning more about what a community of practice is and why they are helpful, I’ve listed a handful of resources below.
Community of practice: why communities of practice are important
CDC: benefits of a CoP
Great idea, right? Now I needed to gain support from others, starting with my boss. I was fortunate to count on two immediate superiors who believed in the concept, and helped me organize my thoughts. They also encouraged me to reach out to colleagues to start defining our COP and its goals. There was one catch though: despite the goodwill from my bosses, I didn’t have a budget.
Cultivating our new community of practice
After a few ideation meetings, we set the foundations for the community by defining our mission:

We also defined some areas of focus to achieve this mission:
Skill building
Technological watch
Market watch
Research papers
Best practices
Shared resources
Collaborative workspace
Facilitate creativity
Track our DataViz maturity
How we organize and structure our community of practice
Since this is a community, we try to have as horizontal a structure as possible, meaning that everyone has the same opportunity to participate in activities, lead workshops and discussions, and take ownership of any item on our planning board. I still act as a facilitator to keep things going. In our context this is necessary; most of our consultants are working full-time for clients, which does not leave a lot of space for internal initiatives.
We leverage Microsoft Teams as our communication and collaboration tool. I find it great for all the flexibility it provides us to centralize the different aspects of the COP: documents, conversations, videos, external blogs, etc. It also allows us to leverage the underlying SharePoint Site for version control and document tracking. Since not everyone is equally active on Teams across the company, we still use email as one of our main information channels.

To be consistent with our areas of focus, we plan activities such as the following:
Challenges, such as building a viz with a new tool
Monthly VendreViz, where we take the lunch hour to present Power BI and Tableau features and discuss a selected topic
Participation in some local user groups
We keep our Teams thread alive with event announcements, questions, and suggestions
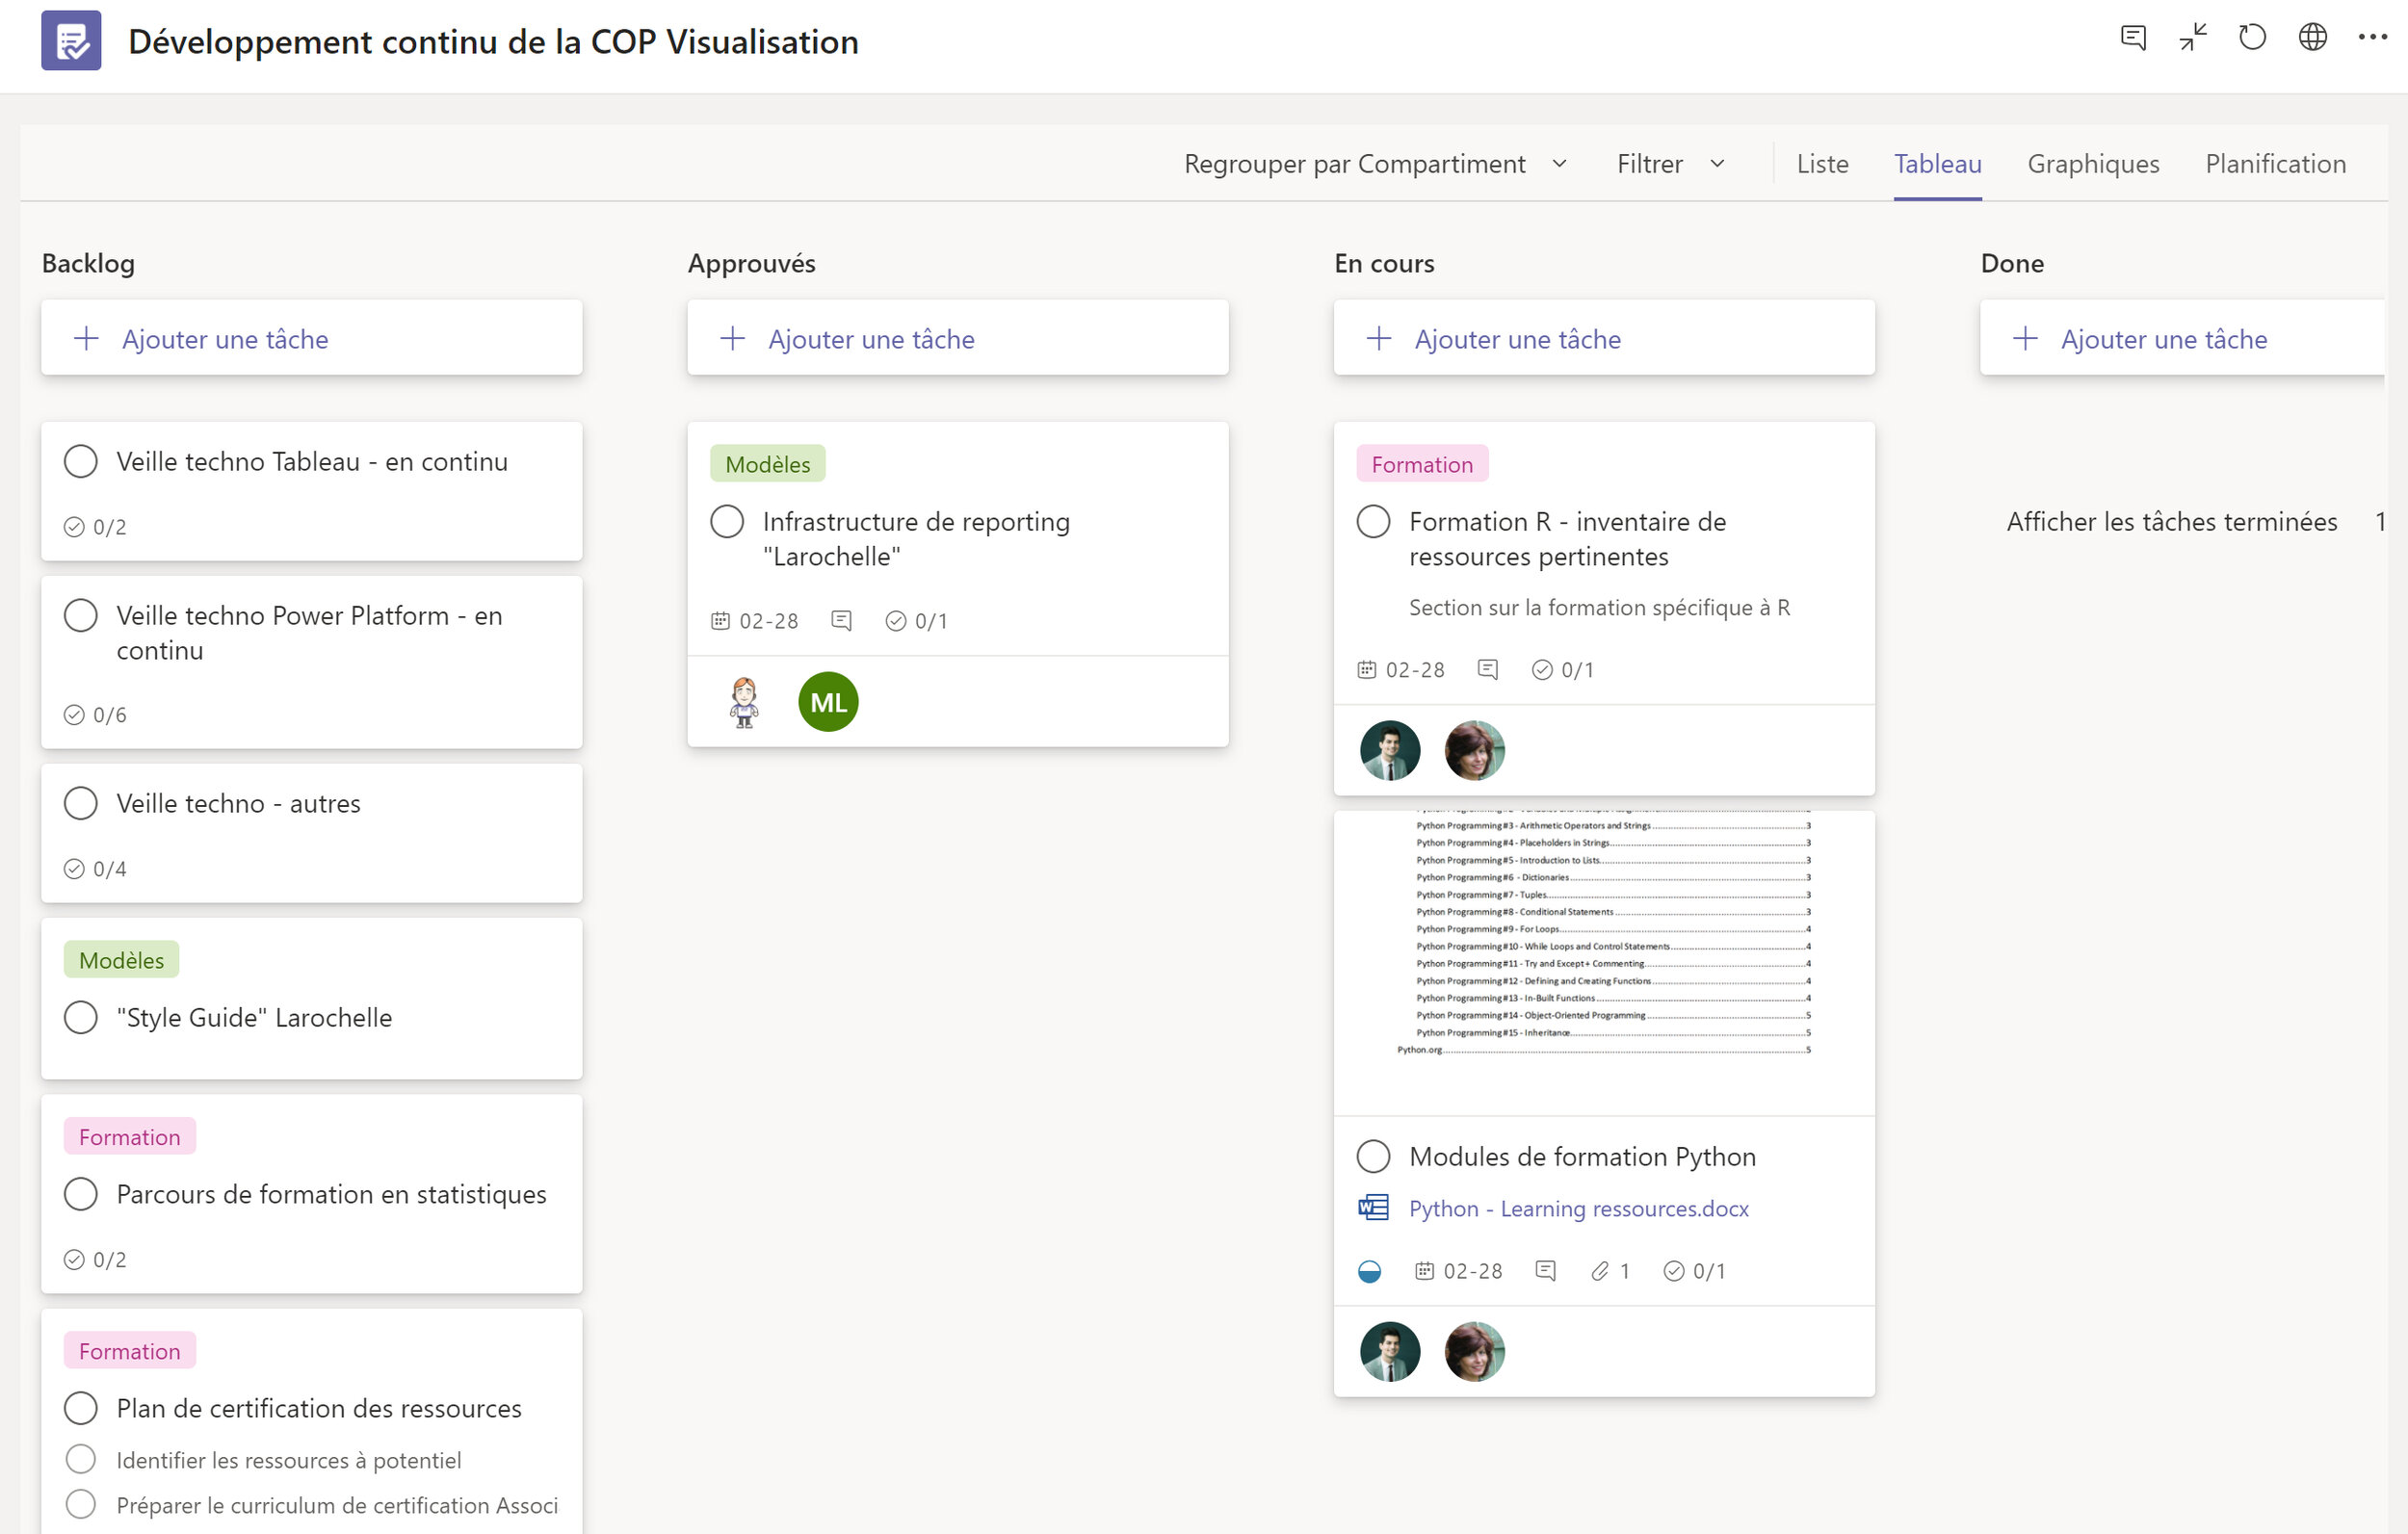
We have a Planner board to keep track of the different initiatives we want to tackle, such as training curriculums or best practices documents
There are currently ten “regular” members of the community, but some activities have attracted up to 25 people, which is great for a company of about 130 employees. To be fair, not all activities are popular (some attract only three people). It is not always rosy-dozy! :)
However, since we now record most of the discussions and activities, regardless of the number of live participants, we are creating a data visualization “memory” that anyone can access at any time. This will have a lot of value as we grow. I have also seen how we can have a tangible impact on engagement for colleagues who are either in-between client work or assigned to a project that doesn’t align with their aspirations.
Conclusion: what’s next for our COP?
Our community will celebrate its 2nd anniversary this year. I am glad we have been able to introduce it, interest people enough to take part and keep it going. We’ll focus on growth this year to ensure it remains a permanent group within our company. To this end, we will start implementing the Wenger-Trayne-DeLaat framework to measure value creation for our community. Another project I’d like to start is a Larochelle Style guide, so we can gradually implement a distinctive brand to our visualization projects. This will definitely lead to rich conversations and discussions, which is what our COP is all about!
Thanks for taking some time to read. I’m looking forward to the discussion this post will (hopefully) spark!
There are plenty of noteworthy members in the community—too many to spotlight at once. This program is part of our larger efforts to find new ways to share multiple voices and experiences. As you discover great work and ideas in the community, be sure to give appropriate kudos and spread the word!