mind the gap: how to represent partial data
When we’re reporting the latest information, it can be challenging to know how to handle data that is still in progress. For example, if we're reporting annual performance trends with only three quarters completed in the latest year, the numbers can appear misleadingly low. If you exclude the latest data points, it could hide crucial details from stakeholders. Audiences often want timely updates, but partial data can cause confusion if not clearly communicated.
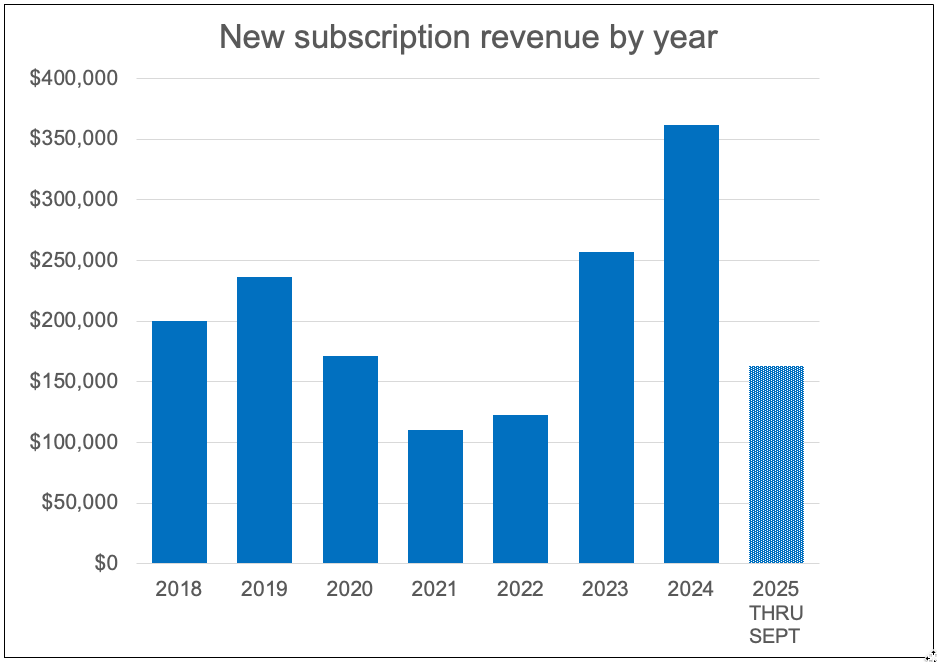
This was a challenge for a client I was recently working with. Take a look at the slide below, which displays new subscription revenue by year.

Upon initial inspection, the 2025 drop-off appears concerning, as it's markedly below that of 2024. However, the 2018 to 2024 data covers the entire year, while the 2025 figure only includes results through September.
In this particular case, the slide was presented live, and the creator explained that the 2025 data was only through the third quarter. After the meeting, though, the slides were shared. This means that anyone who didn’t attend the presentation wouldn’t have that crucial context to avoid panic. Let’s explore four alternative solutions to clearly and effectively share partial data.
Option 1: Differentiate between complete & incomplete data
One of the easiest ways to ensure the 2025 data isn’t mistaken for the full year’s information is to distinguish between full-year and partial-year data visually. For this, we could add a label on the horizontal axis and adjust the bar to a pattern fill. (Similarly, if we had a line chart, we could use a dashed line to indicate a difference.) These visual cues make it clear what’s finalized and what’s ongoing, reducing the chance of misinterpretation.
Additionally, we could go further to provide a sense of where the full year might end up, for comparison.
Option 2: Provide a full year estimate for reference
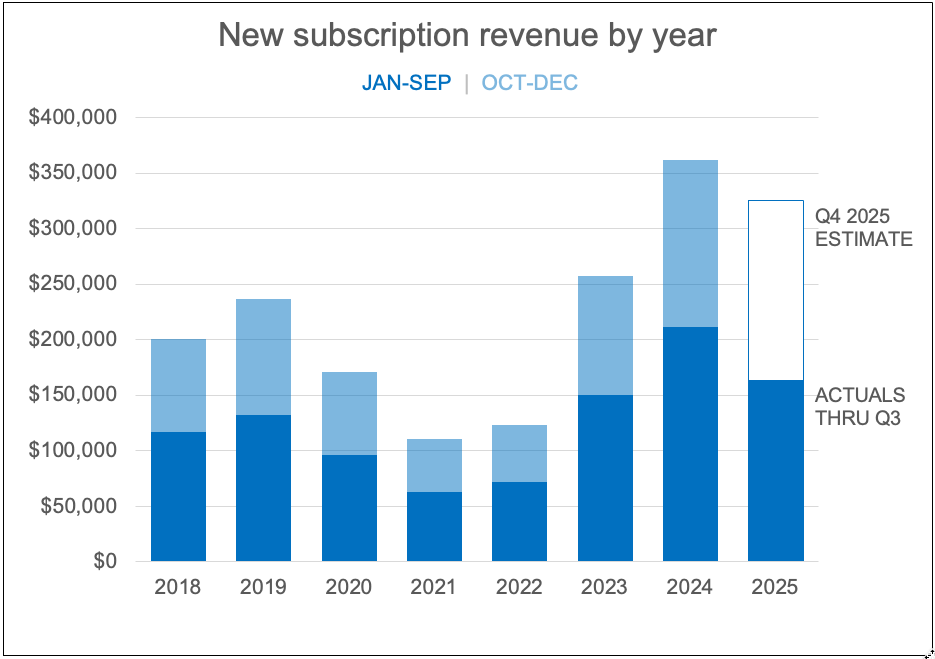
Estimating where the final numbers might land for 2025 is another possible approach. Using a stacked bar that fills in the actual data through September in blue and a pattern-filled segment projecting the fourth quarter could convey this message. This visual sets realistic expectations and helps viewers compare years more accurately, particularly when the visual is accompanied by clear and explicit data labels.

Since the data for 2025 only covers a subset of the year, we could consider providing a sense of how the current year compares to the prior years for a similar time period.
Option 3: Explore using comparable time periods
Our final two options assume that we have access to the data at a more granular level than just the year summary. To compare apples to apples, try showing year-to-date (YTD) results for each time period. For instance, use a solid blue color to represent the data from January to September in each year, and use a lighter fill to indicate the remaining fourth-quarter data. Take care to differentiate 2025 data with an open fill to signal that the Q4 2025 data is not yet available. This approach helps the audience make fair comparisons across equivalent periods.
Option 4: Show more granular details
A final option is to show even more detail. For example, we might plot monthly subscription revenue for each year, excluding the outstanding months for 2025, to highlight the incompleteness of the current year. An added footnote also clarifies when the numbers were extracted, leaving no room for ambiguity.

This more granular view looks quite busy. It is worth considering how much data is required. Depending on the message we want to convey, we might consider keeping only the most recent years. Displaying just the relevant information reduces the cognitive effort needed to understand the trends.
Take precautions when sharing partial information
When sharing data for an incomplete reporting period, be deliberate about context to avoid confusion. Take care to differentiate between complete and incomplete information with helpful labels and annotations, and adjust the marks to ensure they stand out clearly. Consider what your audience needs to know: do they need the latest snapshot, a full-year forecast, or a fair period-over-period comparison? Choose a strategy that provides the most applicable comparison and always makes the completeness of the data unmistakably clear.
To practice implementing these strategies, explore this related community exercise.