

plotting a value within a range
I often refer to my method of creating graphs as "brute force Excel," meaning that you can make almost anything work in Excel, but it sometimes means getting a little creative. The method described in this post can be considered a prime example of brute force Excel, where I walk through the steps for turning tabular data into a value plotted visually within a range.

strategies for avoiding the spaghetti graph
It seems that I have a distaste for any chart type that has food in its title. My hatred of pie charts is well documented. Donuts are even worse. Here's another to add to the list: the spaghetti graph. They look like someone took a handful of uncooked spaghetti noodles and threw them on the ground. There are a few strategies for taking the would-be-spaghetti graph and creating more visual sense of the data. I'll explore three such strategies here.
displaying numbers of different magnitudes
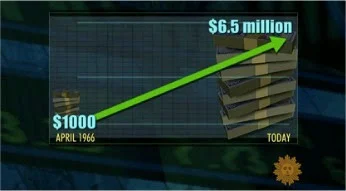
In my workshops, one common question is how to best display numbers of very different magnitudes. In this post, I explore several potential approaches, remaking a less-than-ideal visual from the media.