an expression of ignorance
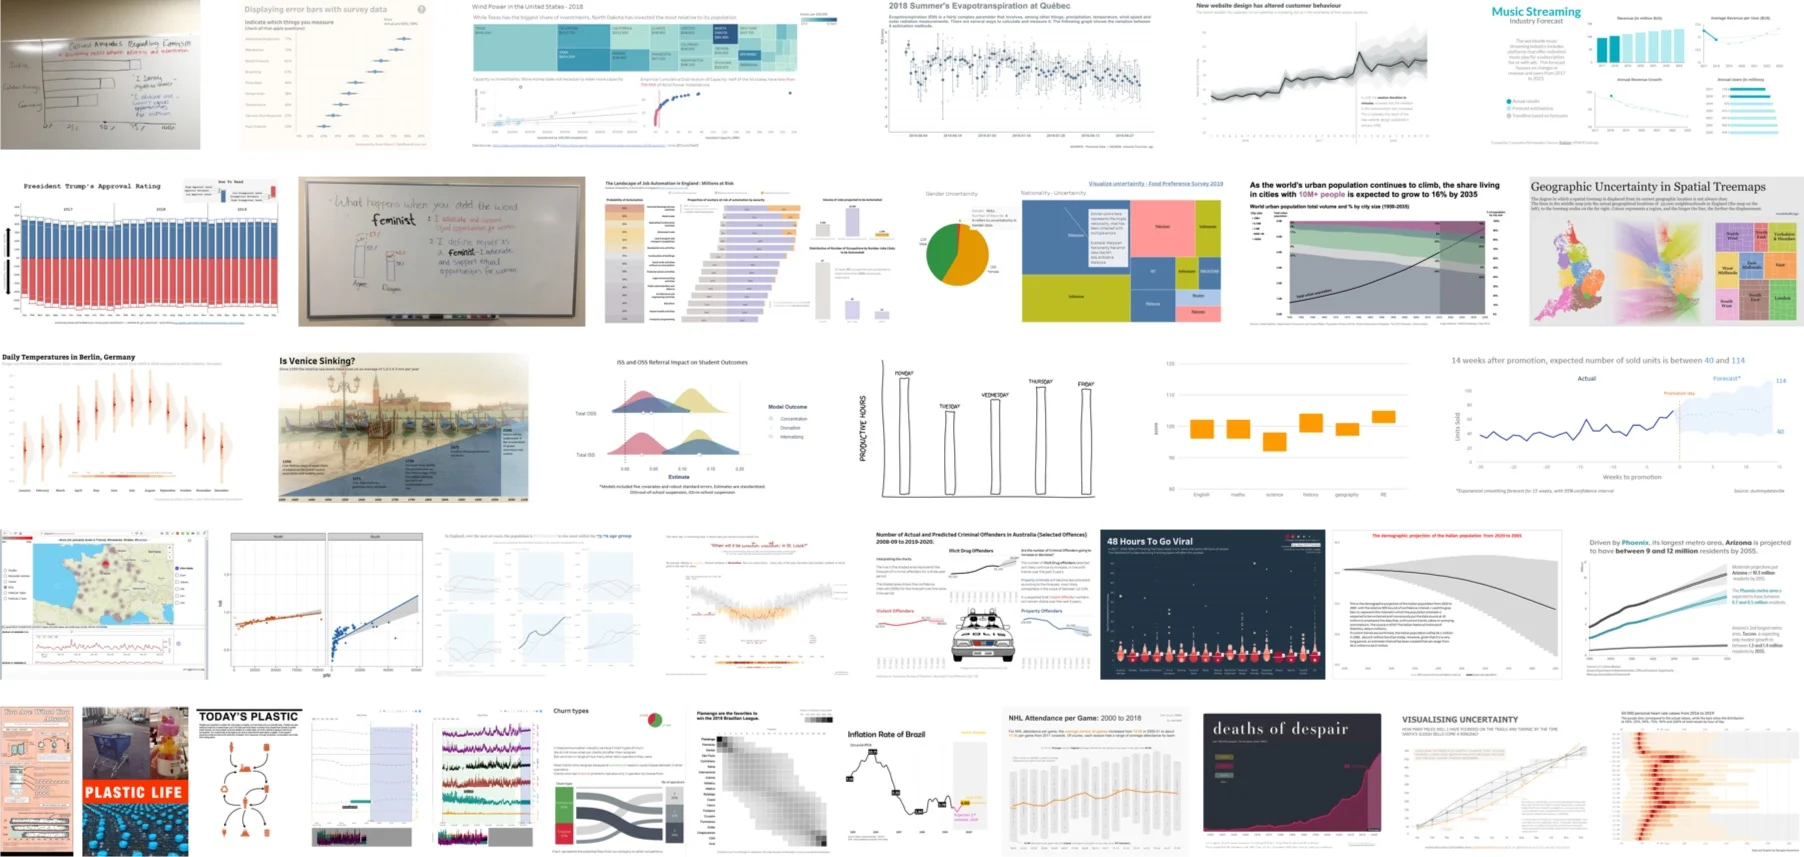
Nearly 40 people responded to our challenge this month, in which we asked participants to identify a situation where it was important to convey uncertainty, and then design a visualization that made that uncertainty clear to the audience. Alberto Cairo, who addresses uncertainty in his upcoming book “How Charts Lie,” provided his thoughts on the challenge, and contributed signed copies of his book for three lucky participants. Our community took a variety of different approaches to the challenge, which makes this month’s gallery an excellent collection of ideas on how to represent uncertainty in different situations.
#SWDchallenge: visualize uncertainty
People like things that are concrete and certain: and so, when we plot our data in a solid point, line, or bar on a graph, it’s easy for people to consider it “truth.” There are times when that is appropriate, and times when it definitely isn’t. Many times, there is uncertainty that we ought to convey in order to provide a more complete picture to the audience. This month’s challenge requires you to identify a scenario and data where there is inherent uncertainty, and design a visualization that makes that clear.

you can take it with you
This month, we offered you an #SWDchallenge created by author, speaker, and technical evangelist Andy Cotgreave, and centered around the way more and more of us are consuming our information: via our mobile devices. While large-format desktop monitors likely won’t be disappearing anytime soon, we must consider mobile devices as a common form factor for all types of personal and professional communications—including charts. More than 20 people took on the task of identifying a visualization they originally created for a desktop viewing experience, and re-factoring it to be useful on a mobile device.

forty-five pie charts? never say never
Here at storytelling with data, we have been known to say things like, “The only thing worse than a pie chart…is two pie charts.” And yet, believe it or not, we’ve found a data visualization that we think succeeds in using not one, not two, but forty-five pie charts. How could this possibly be?