what I look for in effective data viz
Last week, I had the distinct honor of being one of the judges for the very first VizCup, hosted by Facebook. Participants had an hour and their choice of half a dozen or so datasets plus their preferred software to create an interactive data viz. Each group/individual then had 90 seconds to explain and demo their visualization. After an hour or so of seeing some amazing work, the judges narrowed it down to the top five, who each had a little more time to share their viz. Top entries ran the gamut in scope, ranging from being able to see UFO sighting stats on your birthday, to where to locate to avoid natural disasters, to the winning entry that looked at the bias in soccer red card handouts by referee. Interestingly, all of the top entries (and nearly all of the entries overall) were created in Tableau, likely due to its ease and speed in creating interactive visualizations.
Leading up to the event, I put some thinking time to the most important things that I look for when judging the effectiveness of a data visualization. I thought this might be of interest, so will share it here.
At a high level, there are four things I look for when evaluating data viz:
- A sensible display. The choice of graph or visual is appropriate given the data and given the purpose.
- Absence of clutter. I disdain it! The presence of elements that don't carry informative value or aid interpretation in some way will hurt not help when it comes to my evaluation.
- Affordance in design. Through strategic use of things like color, size of elements, spacial position, and text, it is so clear to the audience how to interact with the data visualization that they don't even notice the design.
- A clear story. For me, the best data visualizations are the pivotal point in a story. Use written or spoken narrative (or a combination thereof) to make the story your visualization tells clear.
Big thanks to everyone who worked to make this event a success: the Facebook team, the other judges (Drew Skau from Visual.ly and Anya A'Hearn of DataBlick), and especially Andy at VizWiz for inviting me to take part in the event!
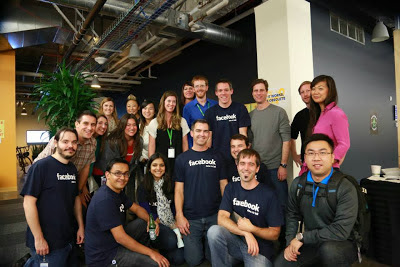
The Facebook team that organized the event, plus judges.