how it came to be

There is so much more that goes into making a book than we typically recognize when we hold one in our hands. I learned a much greater amount about—and took a more active role in—many parts of the process with Let’s Practice! compared to my first book. I’d like to share some of my experiences in a series of posts here. In this first one, I’ll outline the general steps that took place: from me typing words into my computer to you (soon!) holding the book in your hands.
Writing
Writing a book like this was a little different, because it’s not just words, but also graphs (many, many graphs!). So a big part of the work that I’ve lumped into this section is simply creating all of the graphs. While each example was inspired by a real client scenario, in all cases the visuals were built from scratch using new data and changing details to preserve confidentiality. There was also quite a bit of planning over the course of the writing process: figuring out what fits where and rearranging many times as I worked my way through the content. Speaking of content, if you’d like to know more about exactly what Let’s Practice! is all about, check out this recent post.
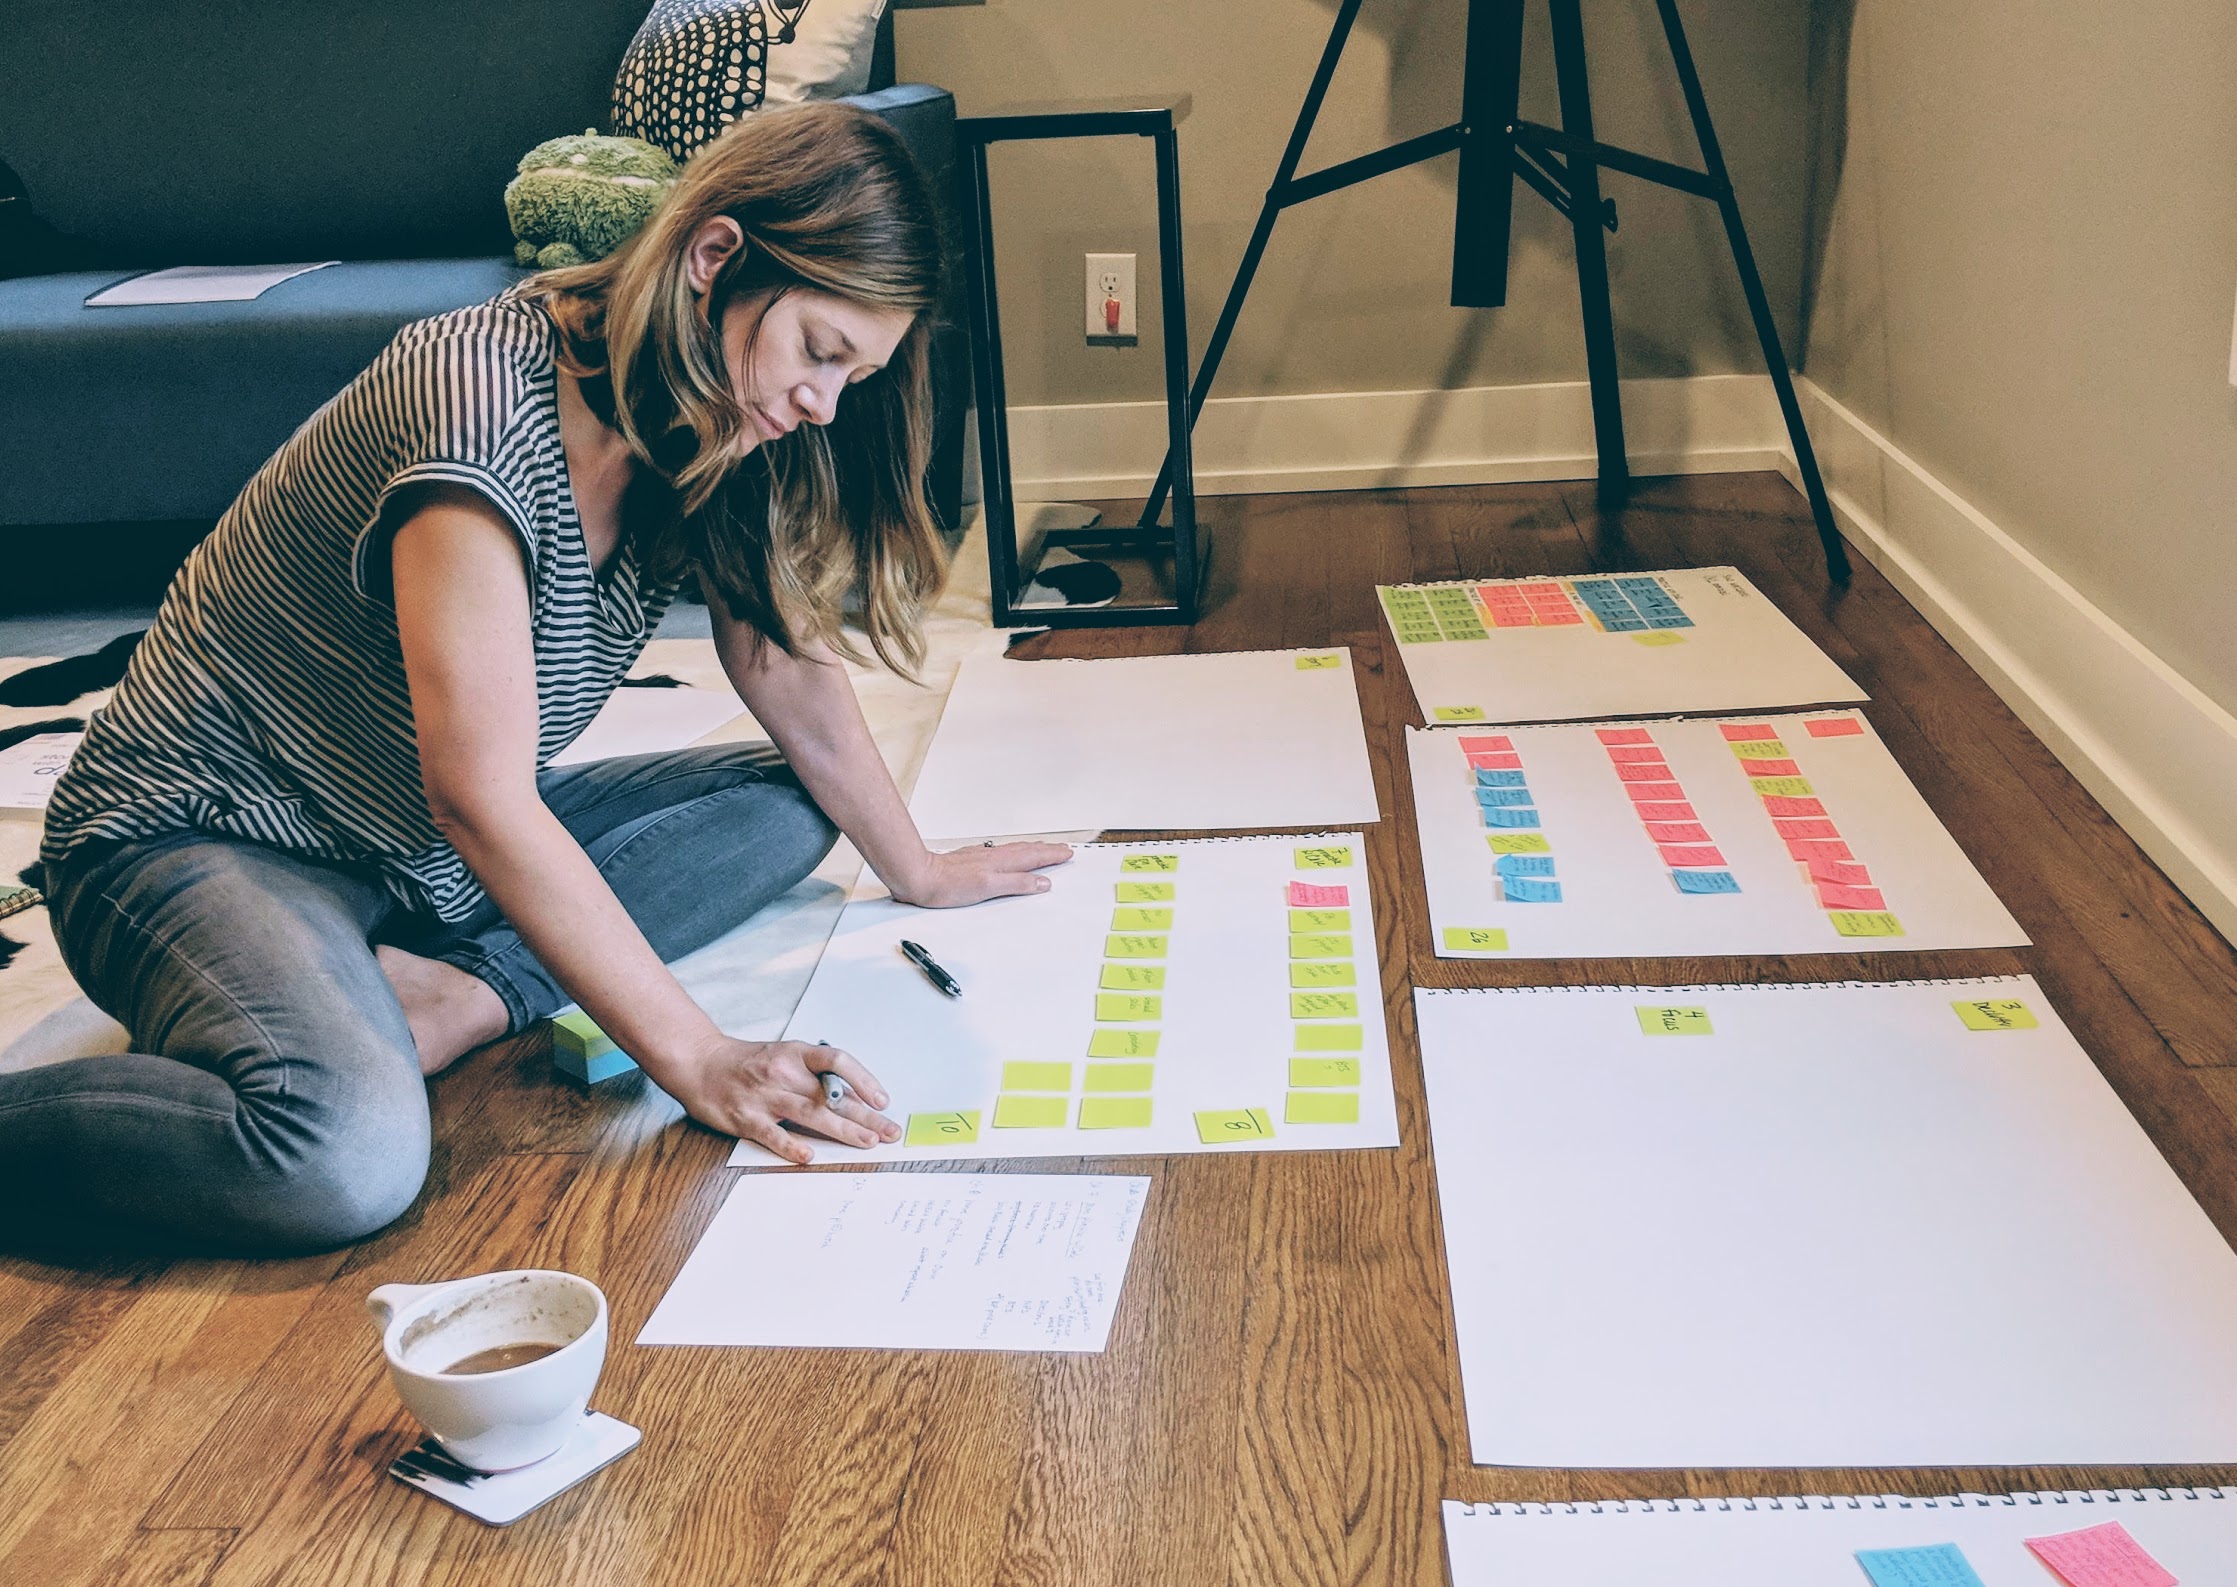
Low-tech planning: sticky note storyboards
One benefit of a book like this is that it is naturally chunked—for the most part, each exercise is its own contained section. This meant that I could focus on one at a time and complete it. Then I might jump to a totally different part of the book and work on something there if I wanted to redirect my energy or an idea struck me. I’ll dive more into my writing process in a future post and also show some of the transitions from my early rough storyboards into the final product.
Editing
In reflecting on the how-the-book-came-to-be process and visualizing it, one thing that became apparent is that more time and attention was spent on editing than any other step in creating this book. For me, it was also the most frustrating component at times!
I was editing, in some capacity, throughout the writing process and beyond. Most of this was done electronically, but I also printed the manuscript on three separate occasions and edited by hand (it’s amazing how much more you catch this way!). And I definitely wasn’t the only one reviewing things; numerous people were involved at different points to correct, offer suggestions, and give feedback through varied lenses. The book is absolutely a better product as a result of the time spent and input received and incorporated. I’ll dive into this more in an upcoming post and share some specific learnings and resources that others may find useful.

My hand-edits on printed copy #1 (of 3)
Illustration & design
It struck me part way into the writing process that it would be neat for the SWD chapter recaps I was planning for the onset of each chapter to be super visual. I also knew I wanted this book to feel less formal than a typical book to encourage people to write in it, get it messy, and really use it—to practice with abandon and without feeling like things need to be perfect.
Hand-drawn illustrations seemed like a great way to meet both of these needs and add some fun to the overall book. I knew one specific person who would be awesome for this: Catherine Madden. I had met Catherine at Tapestry Conference in 2017, when she drew live visual notes for each of the presentations (here’s the one she created for mine). I was thrilled when she agreed to take on this project and had a ton of fun working with her over the course of it. I continue to be in awe of her superpower for taking words and ideas and making them visual. Here’s an example of one of the illustrations Catherine created—this one leads into Chapter 8, “practice more on your own,” and alerts people to some common myths in data visualization:
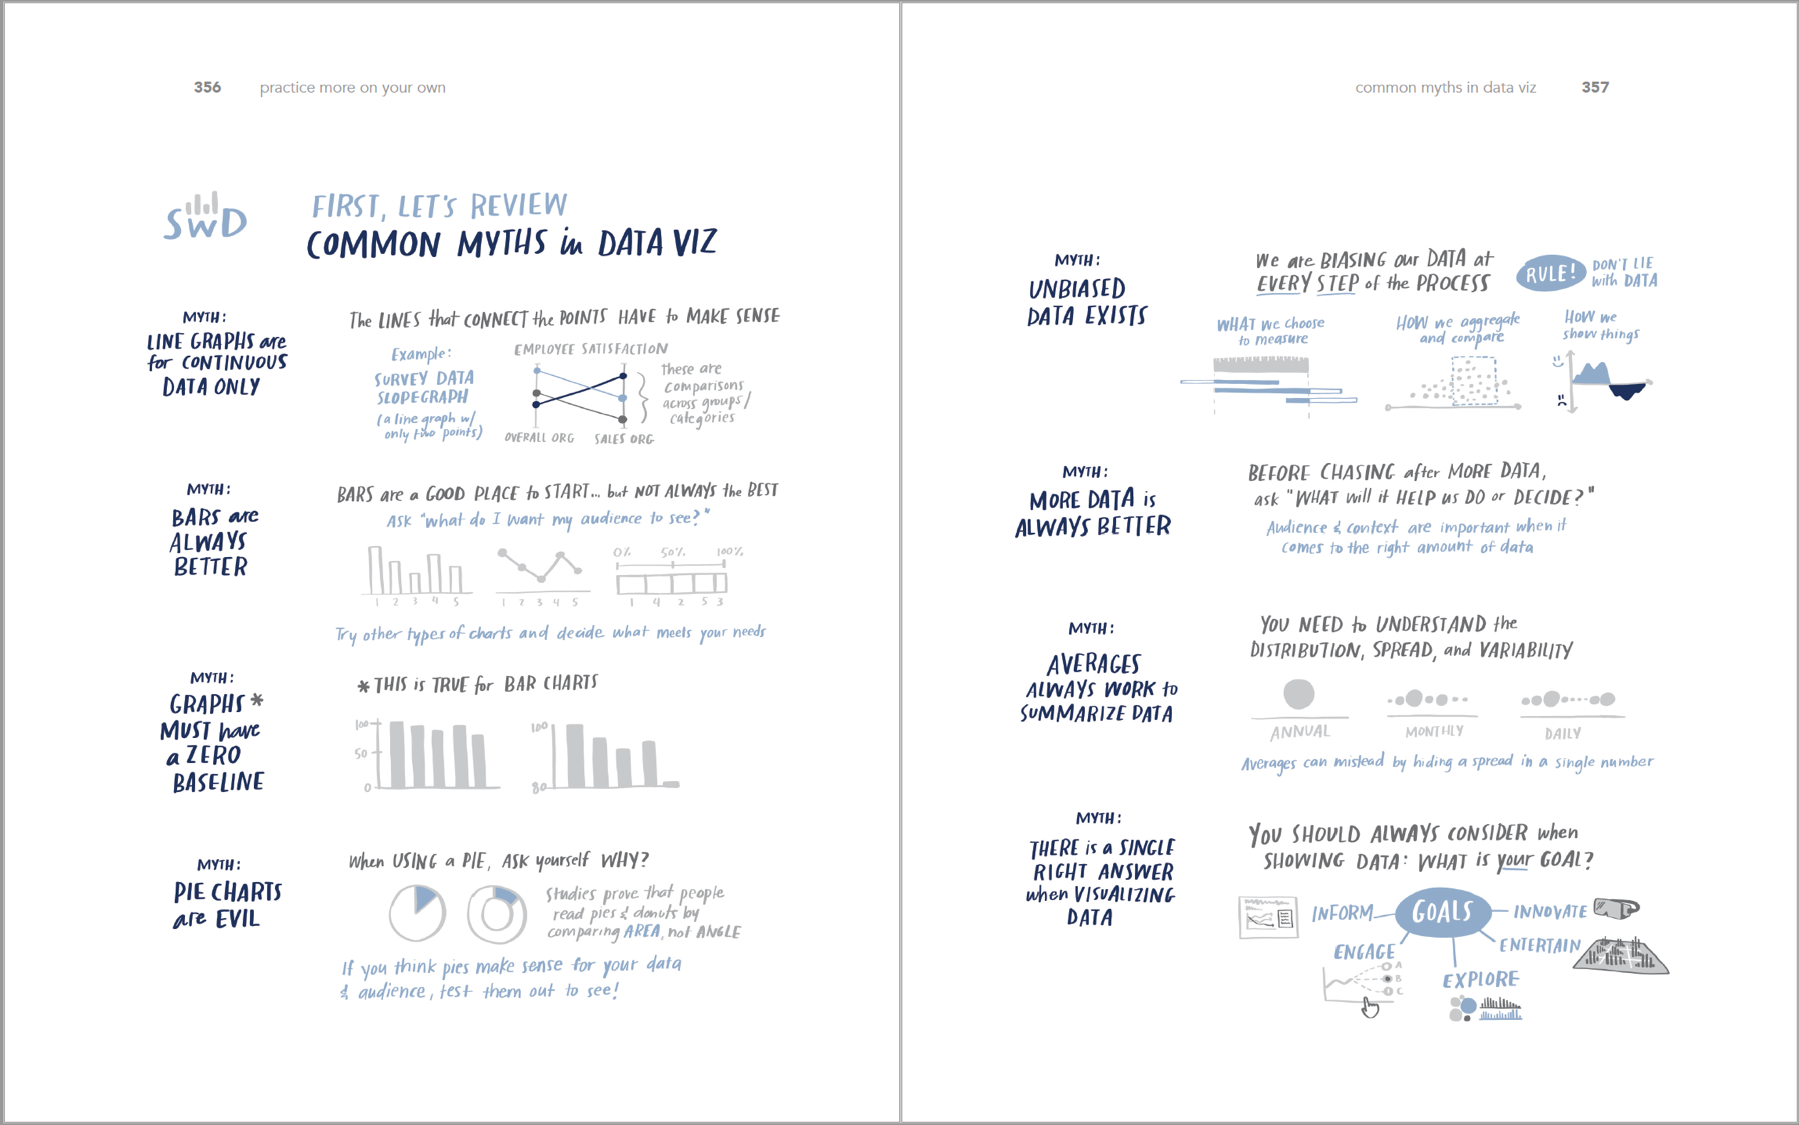
Chapter 8 “common myths” recap | Knaflic, Cole. Storytelling With Data: Let’s Practice! Wiley, © 2019.
The design and layout of a book is typically done by the publisher. But I decided to go a different route this time. Knowing how much iterating it can take to thoughtfully design a book with so many visuals and to allow for flexibility with the use of illustrations, I wanted more control over this part of the process. Catherine brought in Matt at Flight Design Co, who did the heavy-lifting here, designing the book and laying out all of the text and graphics (and being incredibly patient through the numerous iterations to get everything right). Here’s an example 2-page spread leading into Chapter 4 on focusing attention:

Chapter 4 outline | Knaflic, Cole. Storytelling With Data: Let’s Practice! Wiley, © 2019.
Catherine and Matt were both super amazing to work with. Check out Catherine’s related post.

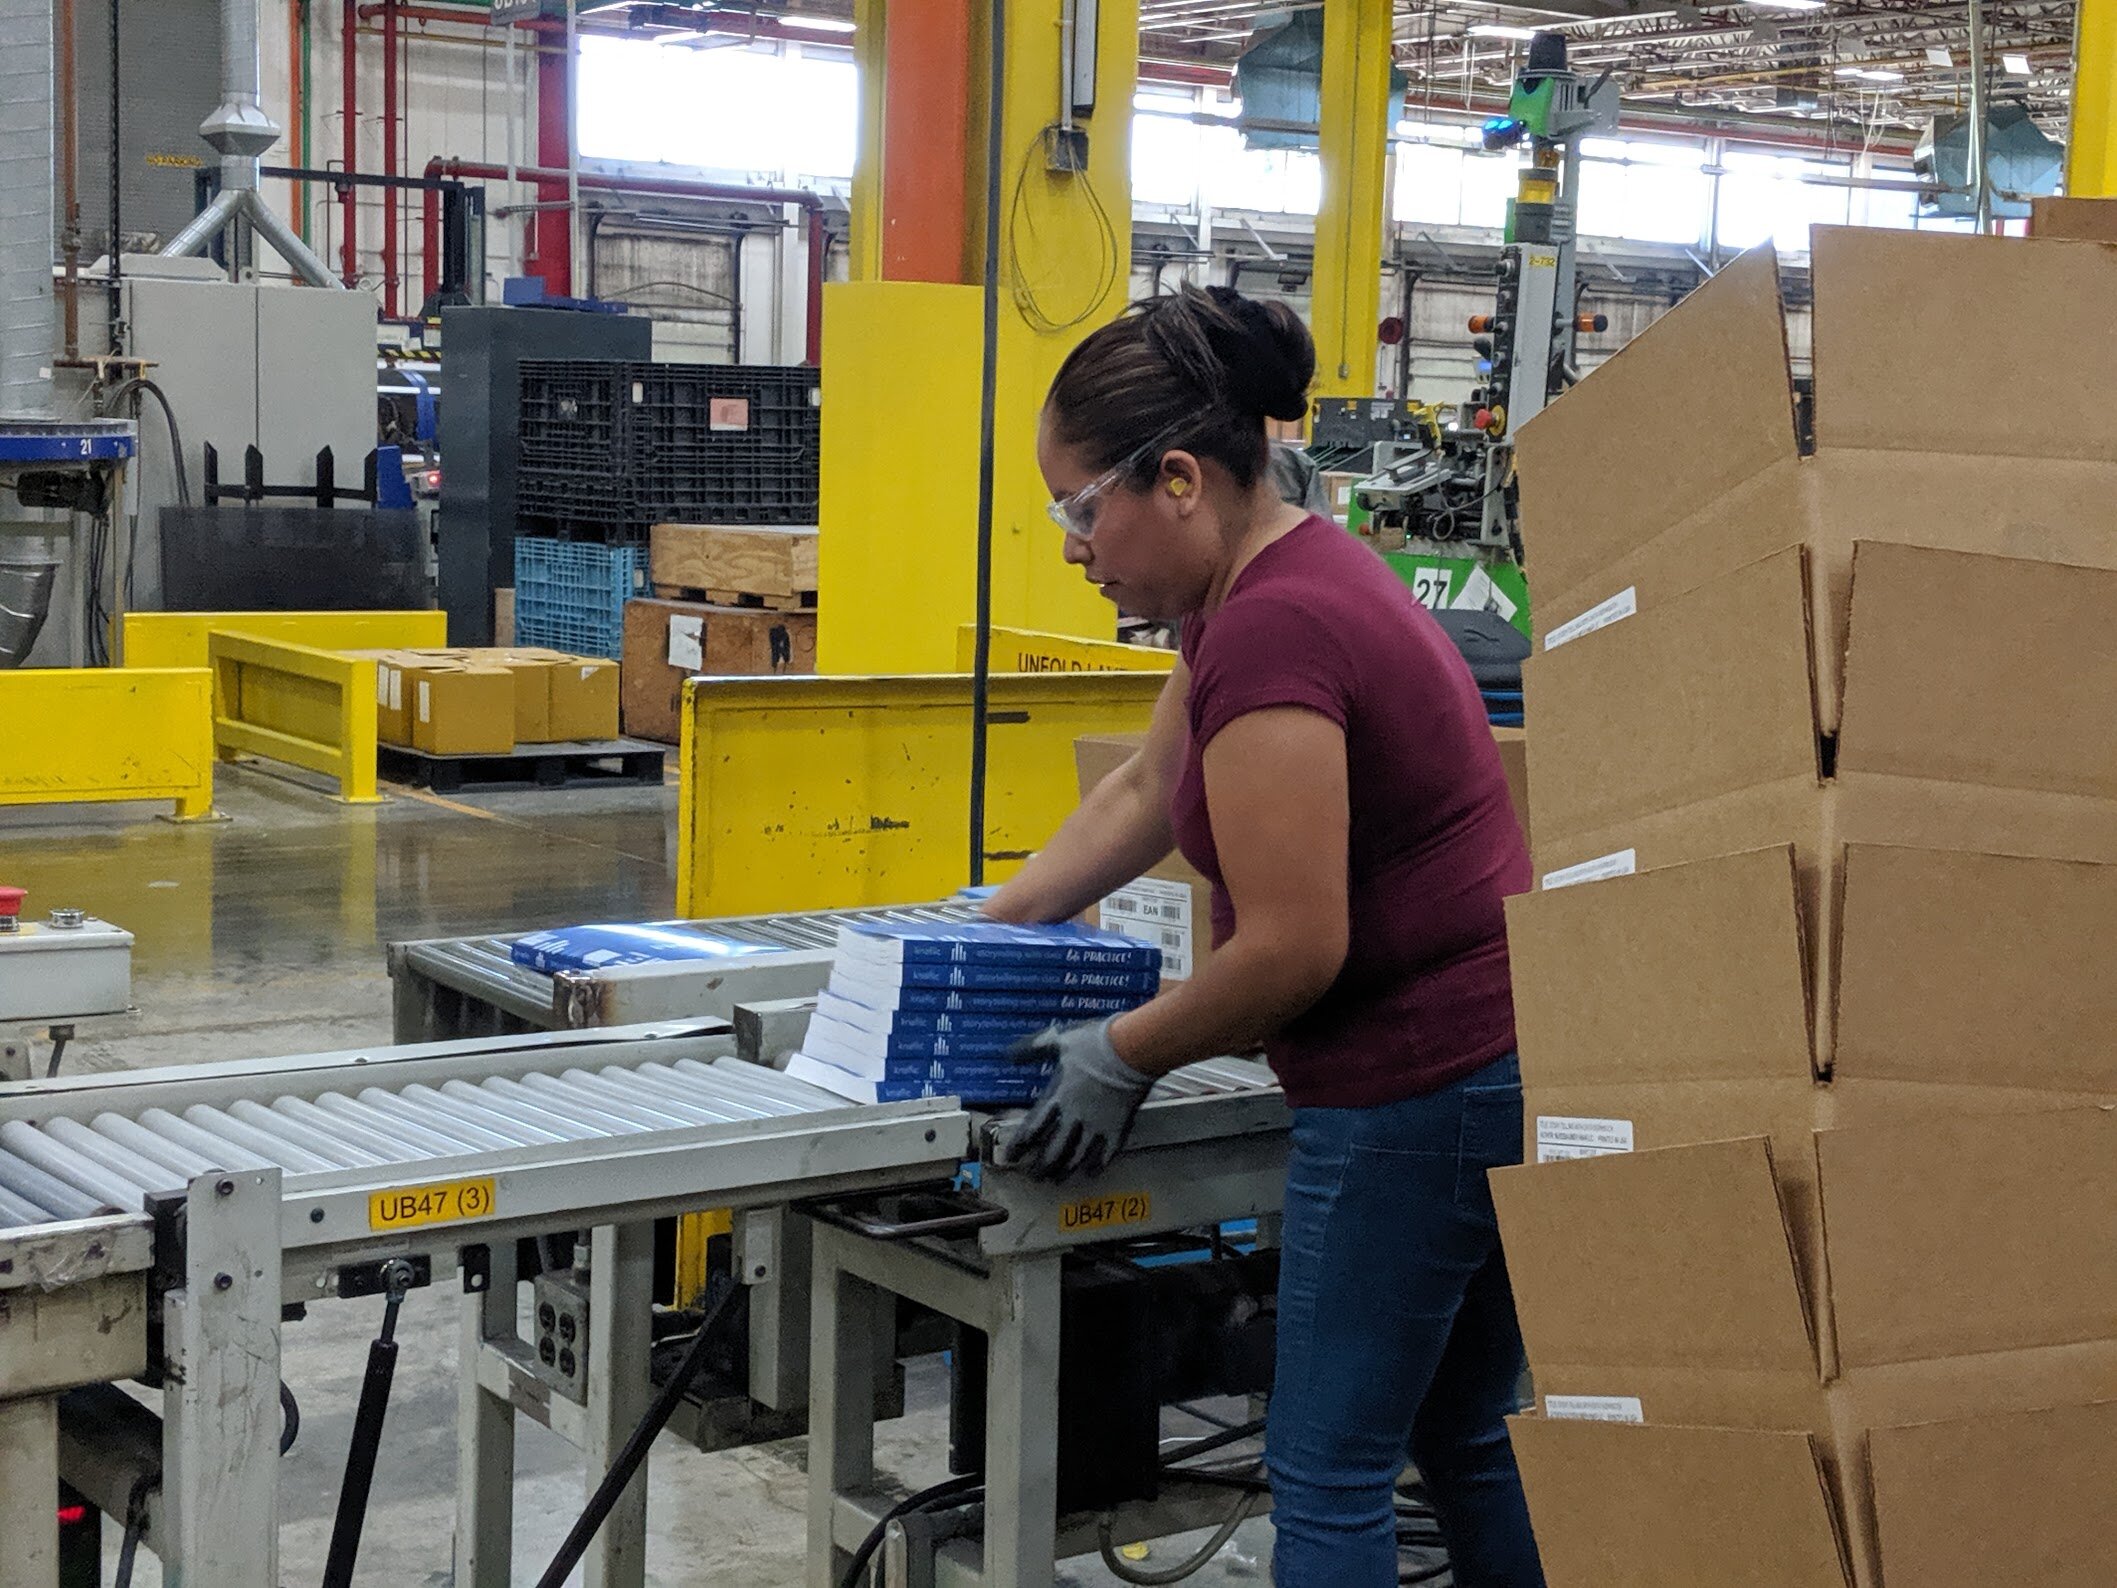
Printing
I had the distinct pleasure of visiting Quad Graphics World Headquarters in Sussex, Wisconsin two weeks ago to see my book printed and again last week to watch it be assembled and bound. I was able to take some of the first copies home with me! This was a fascinating experience and I took a lot of pics that I’ll soon pull together into a follow up post to share.
Distribution
I know least about this part of the process, which is underway now. The gist is: books go from the printer to Wiley warehouses to the various booksellers to you! Don’t forget to pre-order your copy to be among the first to receive it: Amazon, Barnes & Noble, Books-A-Million, or (best) order from your favorite independent bookseller.
For the international audience, there will be a simultaneous publication in Europe and books can be pre-ordered through Amazon UK (hopefully, publication in other languages will follow; since this gets done through deals with other publishers, translations can take a year or more to become available).
The other stuff
This is a simplified overview—I’ve skipped some things. For starters, the gap between having an idea and writing. There is a decent chunk absent from the timeline that begins this post, which is the time between the kernel of the idea and actually beginning to write. I’m a percolator, things mix around and need to reach a boiling point before I’m ready to start. But once I’m ready, I go. That said, I now have absolutely no recollection of how long that time gap was. I suppose it doesn’t matter now.
Another item I’ve skipped is the legal mumbo jumbo and contract negotiations. That took longer and cost a lot more in lawyer fees than I would have liked, but it ended in a good spot. That’s enough about that.
Marketing is the other major workstream that I didn’t include above. My publisher, Wiley, undertakes some of this (optimizing things on Amazon and adding the title to their roster of books to generally promote). Often, authors hire publicists at this point to help bring awareness, but this is a piece we are handling directly. Some of our efforts to date have included offering early sample content to university instructors and arranging special bulk pricing for our clients (which I’ve just officially made available to everyone reading this, too!). Our workshops also act as great ongoing advertising—our final public workshop this year coincides with the official book launch and we have added a new half-day custom workshop to our offerings based on the new book.
I hope you enjoyed this overview, and that you’ll find the forthcoming deep dive posts interesting, too!
Finally, don’t forget to pre-order storytelling with data: Let’s Practice! to be among the first to hold it in your hands—and hopefully now that you’ve read this, you’ll be fully appreciative of all the effort—by so many people—that went into it!