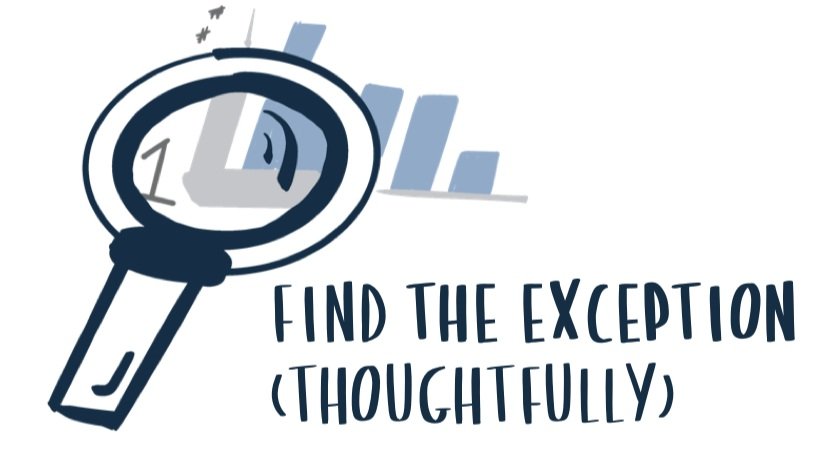
#SWDchallenge: find the exception
I'm the younger of two children, and I certainly lived up to the stereotype of being the last born. I broke many rules and challenged my parents in ways they wouldn't have imagined my older brother doing. While I've (mostly) outgrown my childish ways, I still enjoy pushing the boundaries, even in my work.
I'm sure you've heard people list rules for data visualization or slide design that you should always follow. For example:
Bars should always start at zero.
Don't use gridlines.
Lines are only for continuous data, and bars are for categorical data.
Pie charts are evil, so you shouldn't use them.
Don't add more than 6 colors to a graph.
Red and green color combinations are bad.
Numbers in a table should always be right-aligned.
Follow the PowerPoint 7x7 rule (no more than seven lines of text with seven words max on each line).
Limit your presentations to one graph per slide.
…the list goes on and on.
Here’s a secret, though: I've intentionally broken almost all of these "rules"—and recently! That's because none of these are hard-and-fast rules—they are simply guidelines rooted in best practices. The intentions behind these guidelines may be good, but rest assured: there are always exceptions!
Last year while working on a client makeover, I created a bar chart that didn't start at zero (you can read my complete thought process here). Before that makeover, I believed that all bars needed to start at zero—no exceptions. Now, my thinking has evolved; and, since completing that first makeover, I've encountered a second, separate instance where non-zero bars could work. By challenging preconceived notions, I forced myself to go beyond following a simple rule and gained a deeper understanding of the reasoning behind the “best practice.” Knowing the bigger picture gives me the confidence to thoughtfully bend the rule if the scenario calls for it.
This month, I encourage you to find your inner rule-breaker! Explore the limits of the “rules” in the data and communication space, look for the exceptions, and see what you can learn from the experience.
The challenge
This month, choose a rule or guideline and thoughtfully break it. I repeat, thoughtfully break it. I’ve listed a handful of common beliefs above for you to challenge, but feel free to think of your own.
When providing your submission, let us know which rule you’ve broken and what you learned. Will you break the rule again—under the right scenario—or do you believe the rule exists for a reason?
Share your creation in the community by Thursday, June 30th at 3PM PT. If there is any specific feedback or input that you would find helpful, include that detail in your commentary. Take some time to browse others’ submissions, too, and share your input via comments and data points over the course of the month.
Related resources
To get you started, here are a few examples of where people pushed the boundaries and thoughtfully created something unconventional:
Ash Shih: 45 pie charts in 6+ colors
Hans Rosling: animated bubble charts
Jon Schwabish: two pie charts
Mona Chalabi: red and green together
Naomi Robbins: support for gridlines
Nigel Holmes: gridlines & a right-hand-side axis, plus forgoing precision
Robert Kosara: controversial circular bars & gauge charts
SWD examples: non-zero bars, different axis ranges for small multiples
We can’t wait to see what you experiment with!