exploring data is different than explaining data
Today’s topic was inspired by a discussion in a recent client workshop. At the beginning of our sessions, we ask attendees to share what they want to learn during our time together. Their answers usually include being more concise, creating better presentations, getting stakeholders to act, ways to visualize data differently, and so on.
Recently Mike and I were conducting a session where these two responses came in back-to-back:
Participant 1: I want to learn to create interactive data visualizations that enable my stakeholders to find the story.
Participant 2: I want to develop a sharper editorial eye for what data to include to tell the right story.
While these two responses might seem at odds with one another, they really aren’t. They’re just describing two different stages in the analytic process: the exploratory stage and the explanatory stage.
Exploratory analysis is what you do to get familiar with the data. You might begin with a hypothesis or question you want to answer, or you might just look at the data from different angles to find what’s interesting about it. We’re often using dashboards (or interactive data visualizations, as Participant 1 described them) in this step of the process. When designed well, they can lead us to insights faster.
Compare that to explanatory analysis, which is when you’ve identified something specific, and are ready to communicate it to someone specific. At this stage, we’re all about driving action and positive change: we want to make it abundantly clear to a decision-maker that something demands attention and (hopefully) action. This requires—as Participant 2 put it—developing a sharper editorial eye for what data to include.
The challenge with using the same output from our initial exploratory analysis for our final explanatory communication is that it will often include not just the important, actionable insights, but also a bunch of other irrelevant details. For our audience, that makes the story harder to absorb.
To be effective data communicators, we should strive toward Participant #2’s goal: developing a sharper editorial eye for how to weave data into an overarching story.

Illustration by Catherine Madden
I’ll use a recent client makeover to illustrate why the visual you use in exploratory analysis might—and should—differ from what you use to communicate.
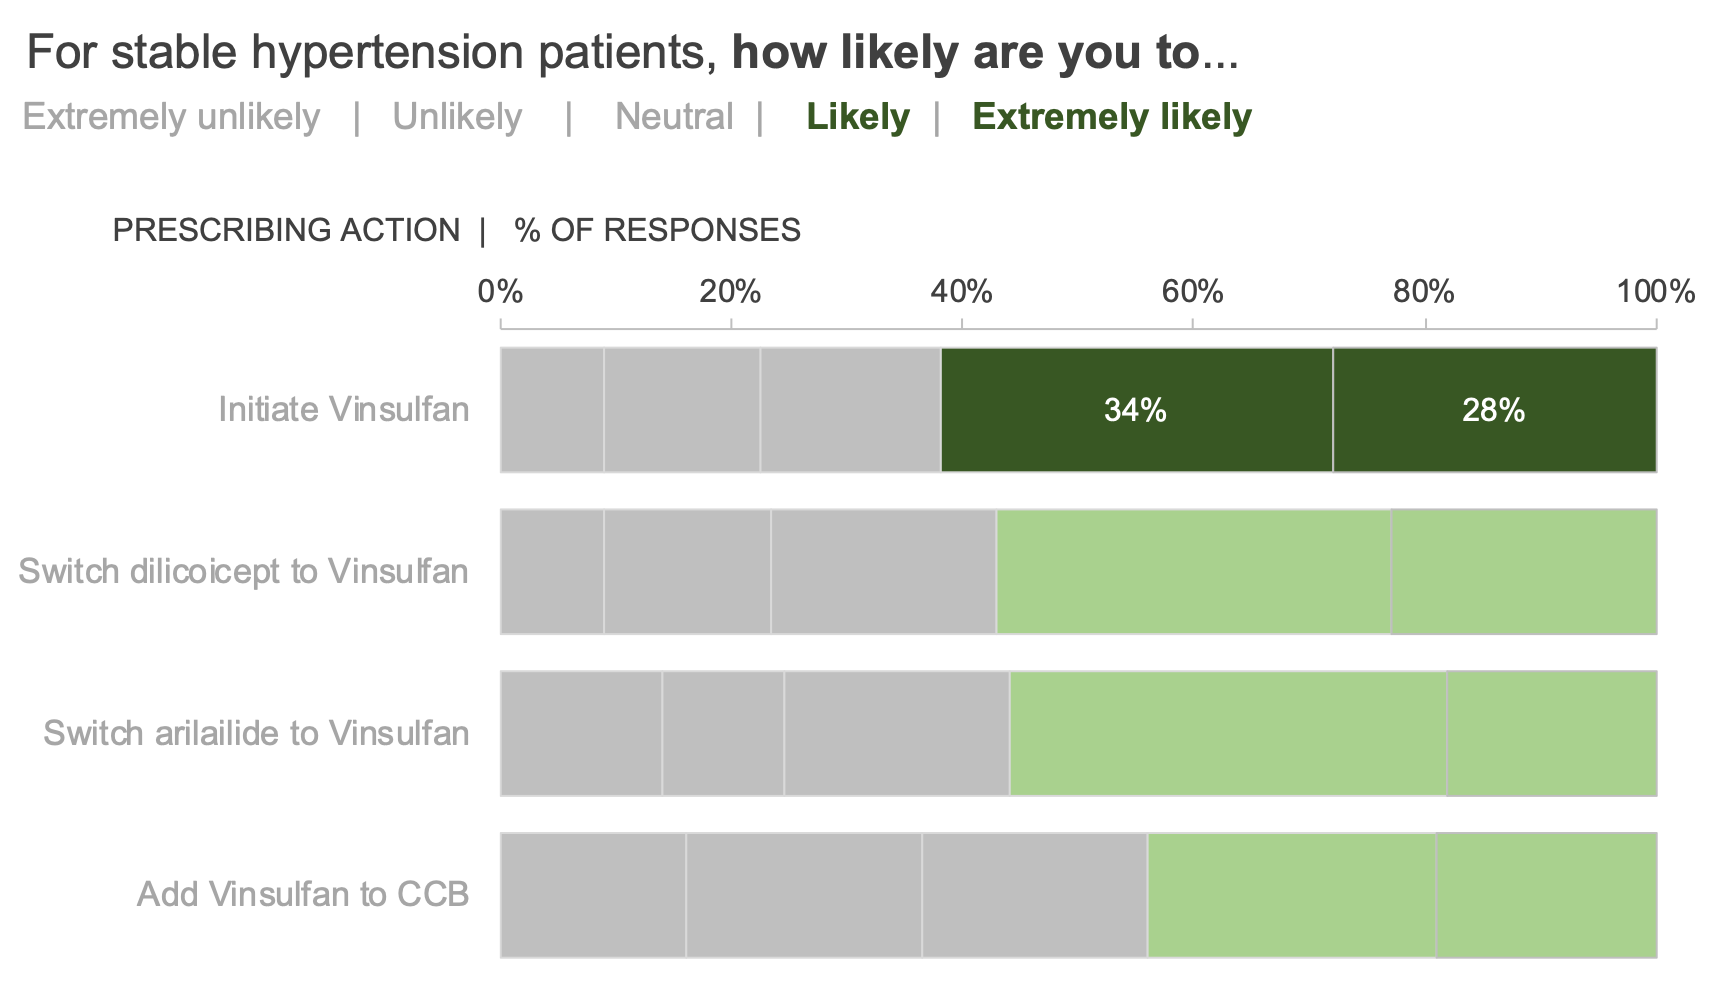
In this example, imagine you work for a pharmaceutical company that is conducting market research on your newly launched hypertension therapy, Vinsulfan. A third party aggregates and provides the data to you for analysis. One metric—physician's likelihood to prescribe—is shown in the graph below. (Details, including the names of the drugs, have been modified to protect client confidentiality.)

This view might suffice for you during your initial analysis. However, once you’ve identified what’s interesting about the data, you should modify this visual so that those insights stand out more for your intended audience.
For example, let’s assume we want to draw attention to the favorable responses—”likely” and “extremely likely.” I can use color sparingly to emphasize the proportion of these actions. Here I’m electing to use green to focus attention because it’s the drug’s brand color—a different scenario might call for a different color palette.

Or, I might even modify the intensity of color to draw attention to one particular insight—in this case, that more physicians responded favorably to initiating our brand than the other options.
If I really want to make sure my audience doesn’t miss the point, I should state that in words:

Or, I could summarize multiple takeaways with a single slide like this:

Compare my original exploratory visual with the one I’m using to explain my findings. It’s the same data in both cases, as well as the same chart type, and many of the same words. But in the end, some minor modifications to the color and words I use make my actual insight unmistakable, and my recommended action clear. In the final visual, I’ve honed my editorial eye towards highlighting how this data fits into an overarching story in my organization.

Here are some additional resources to help you and others you work with practice differentiating between exploratory and explanatory analysis:
READ: another example, five questions to ask yourself when explaining data, the role of dashboards
WATCH: how to pull a story out of a dashboard (open to premium members)
PRACTICE: create a story from a dashboard (August 2021 SWD challenge)
ATTEND: our Fall 2021 webinar series (specific topics below)
