
In a recent client workshop, I recommended a brute-force method to grab your audience’s attention: a text box with an outline to call out the key takeaway. This is an easy option when you don’t have the time or flexibility to use other methods. Then, an attendee told me that after years online, they've learned to tune out pop-up windows and wondered whether a box outline on a slide would just get ignored too.
In our workshops, we teach preattentive attributes: visual cues that we notice before we’re consciously aware of them. That noticing happens in the split-second early stages of memory where our brains decide what to pay attention to. An outlined text box uses one of these cues, enclosure, to point the audience to what matters most. This is a common way to highlight annotations in a graph.
The research behind preattentive attributes is well established; it’s been studied for decades. But lived experience is real, too.
So should you stop using outlines on your annotations entirely? The underlying principles still apply, but no single technique will work equally well for everyone. Outlining isn’t the only way to focus attention on something important in your visual though. Let’s discuss some examples before moving onto what to do if you stumble across this situation in the workplace.
Using one attribute might not be enough
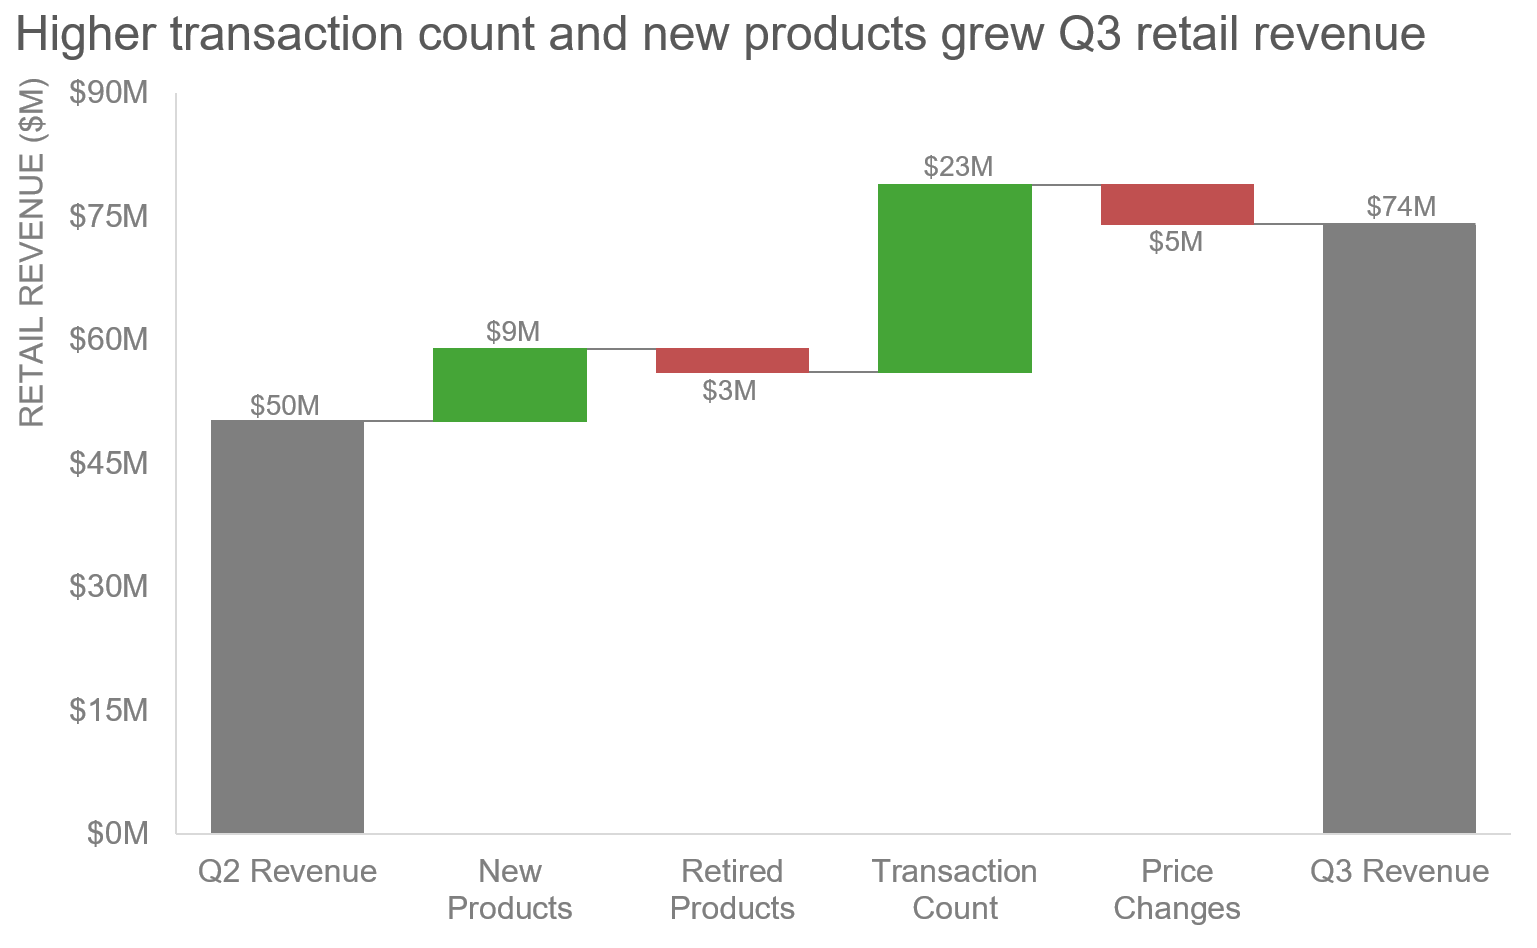
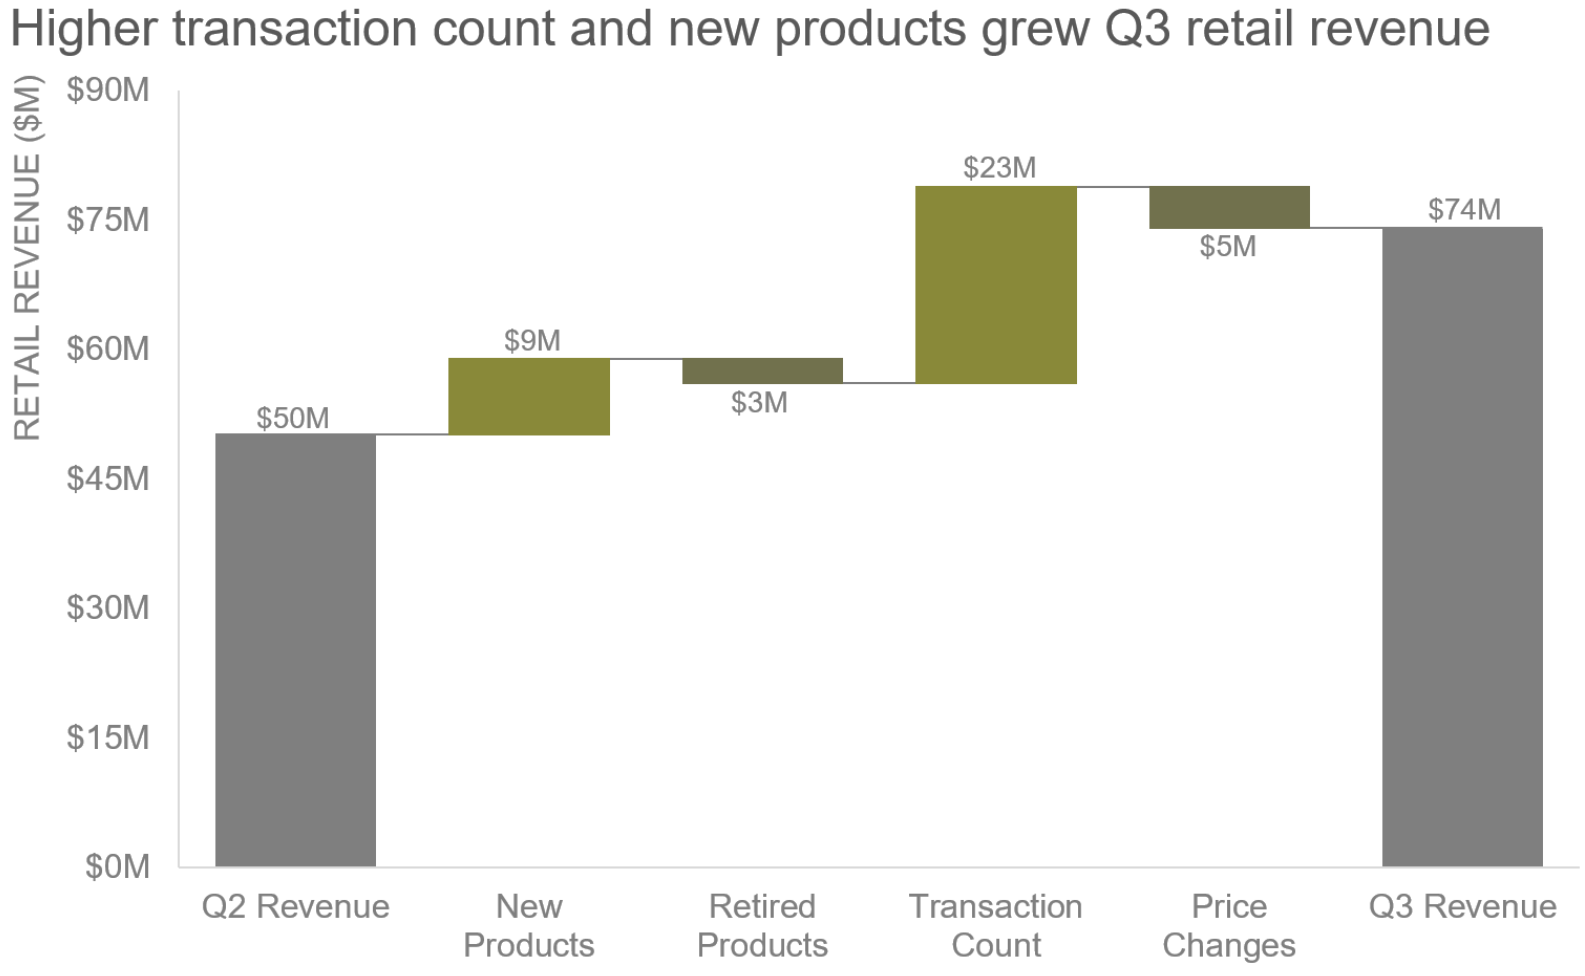
Take color, one of the most powerful preattentive attributes. We talk a lot about how to use color sparingly in data visualizations, but not everyone sees color the same. In a prior consulting role, I created waterfall charts for clients’ retail sales reports using green bars for growth drivers and red bars for declines. To me, this color scheme felt common and intuitive. When I showed one to a colleague with deuteranopia, a green color vision deficiency, she asked me why I used a similar color for gains and losses. Whoops! I hadn’t considered how these colors might not work for my audience.
Here’s how my waterfall chart looked to me:
Here’s how my waterfall chart looks through a colorblindness simulator set to deuteranopia.
Color isn’t the only attribute that can backfire. Motion can, too. A leader at a previous employer presented new software products and features at a company-wide meeting. They used animations on a slide to introduce many types of charts this new tool could create. As each chart flew across the screen, I stared like a dog spotting squirrels through a window. I didn’t take in a single detail about the charts or a word the presenter said. I live with inattentive attention deficit/hyperactivity disorder (ADHD). Like many people with ADHD, I’m especially tuned to motion. The leader hadn’t considered how the motion might be distracting to any audience member, let alone people like me.
What could that leader and I have done differently? We both underestimated the importance of audience, but we also leaned too heavily on one attribute. If you’ve been reading the blog, you know that we talk about audience a lot. This is one more reason we keep coming back to audience.
Knowing your audience matters as much as knowing the science, because what gets in the way isn’t always a preference. Sometimes it’s how someone’s eyes or brain work. One way to get ahead of that is to learn more about your audience. Another is to layer multiple attributes together, which reduces the risk that our approach will miss the mark.
Learn what works for your audience
If you have access to your audience, you can bring them examples. Ask them directly:
What draws your attention?
What took you several reviews to notice?
Do you have any preferences or pet peeves?
Is anything distracting or hard to see?
You won’t always be able to ask them yourself. When you can’t, here are a few additional ways to know what they might expect:
Look for their past work at your organization.
Search for articles, professional social media posts, or podcast interviews where they talk about data.
Speak to people who have worked with them before. Did specific visuals or chart types resonate with them?
Conducting research isn’t the same as working with your audience, but it can give you a leg up and help make a strong first impression. These examples of how they talk about, design, and present data can illuminate your approach.
Combine attributes thoughtfully
Think back to my green and red waterfall chart. Color could still work if I use it more strategically. Here are the steps I took to update the waterfall chart below:
Swapped my increasing bars’ color to blue, which stays distinct for people with the most common types of color blindness.
Changed the decreasing bars to gray to keep the emphasis on the increases.
Added arrows to indicate the direction of change on the increasing bars. Alternatively, I could have added “+” to the data labels above the increasing bars, and “-” to the labels below the decreasing bars.
Connected the insight in my title to the bars using a bold blue font.
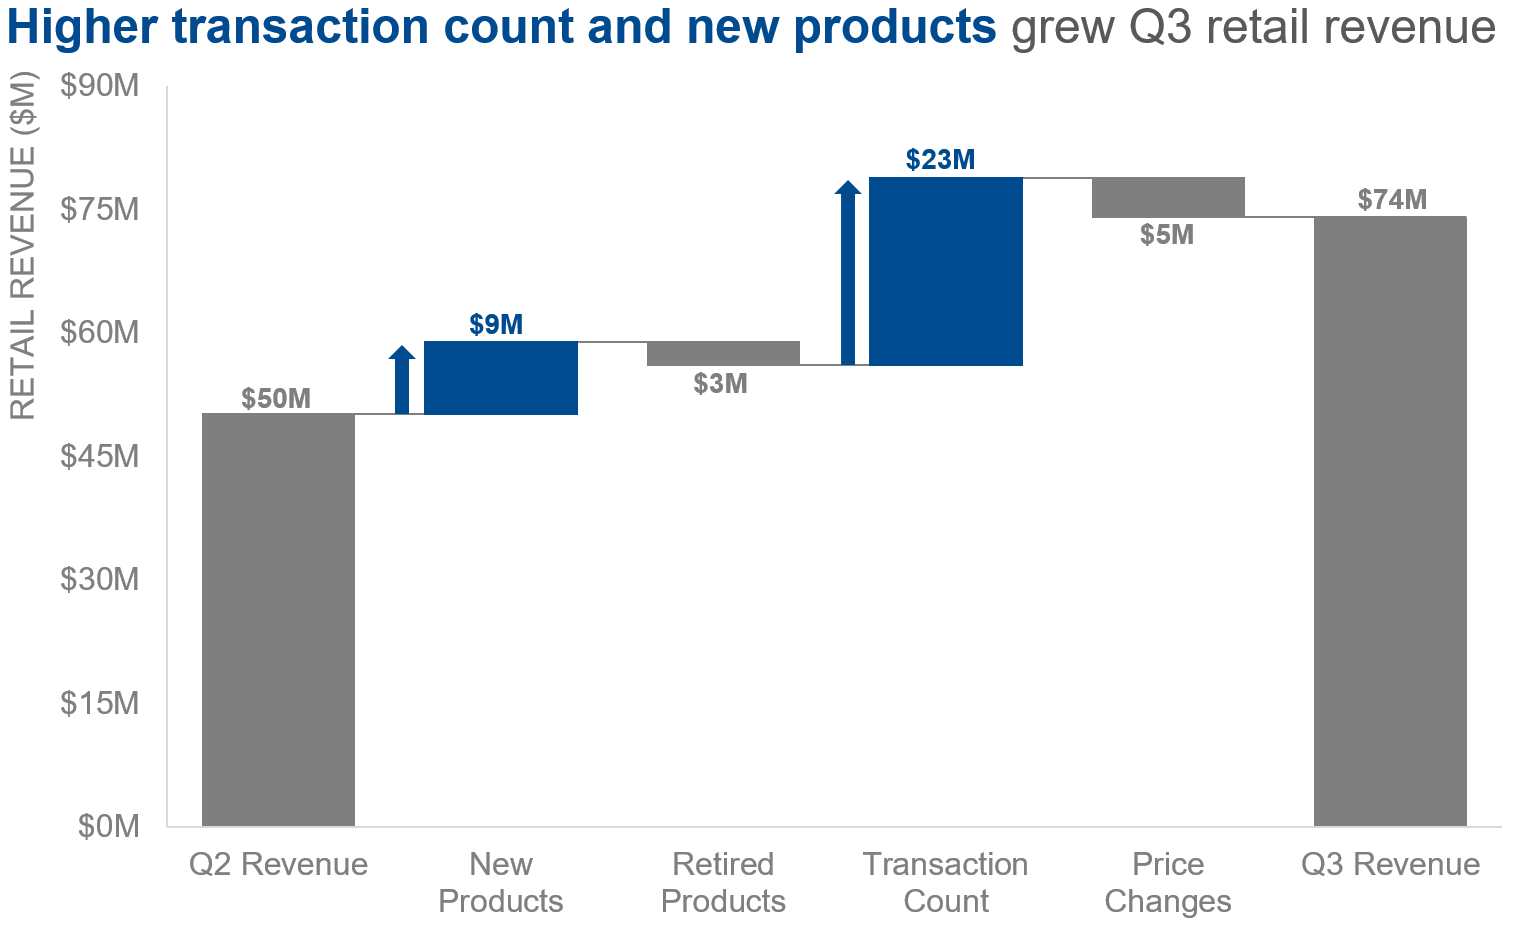
Don’t rely on a single cue to make your point. Combining preattentive attributes, like color, bold text, and added marks, makes it clear what matters.
Doing your research goes a long way. Learn what you can about your audience, and don’t lean on a single preattentive attribute to get your point across. So what would I tell that workshop attendee who tunes out pop-up windows? Callout boxes with outlines are staying in my toolkit. For that attendee, though, I’ll think outside the box.
