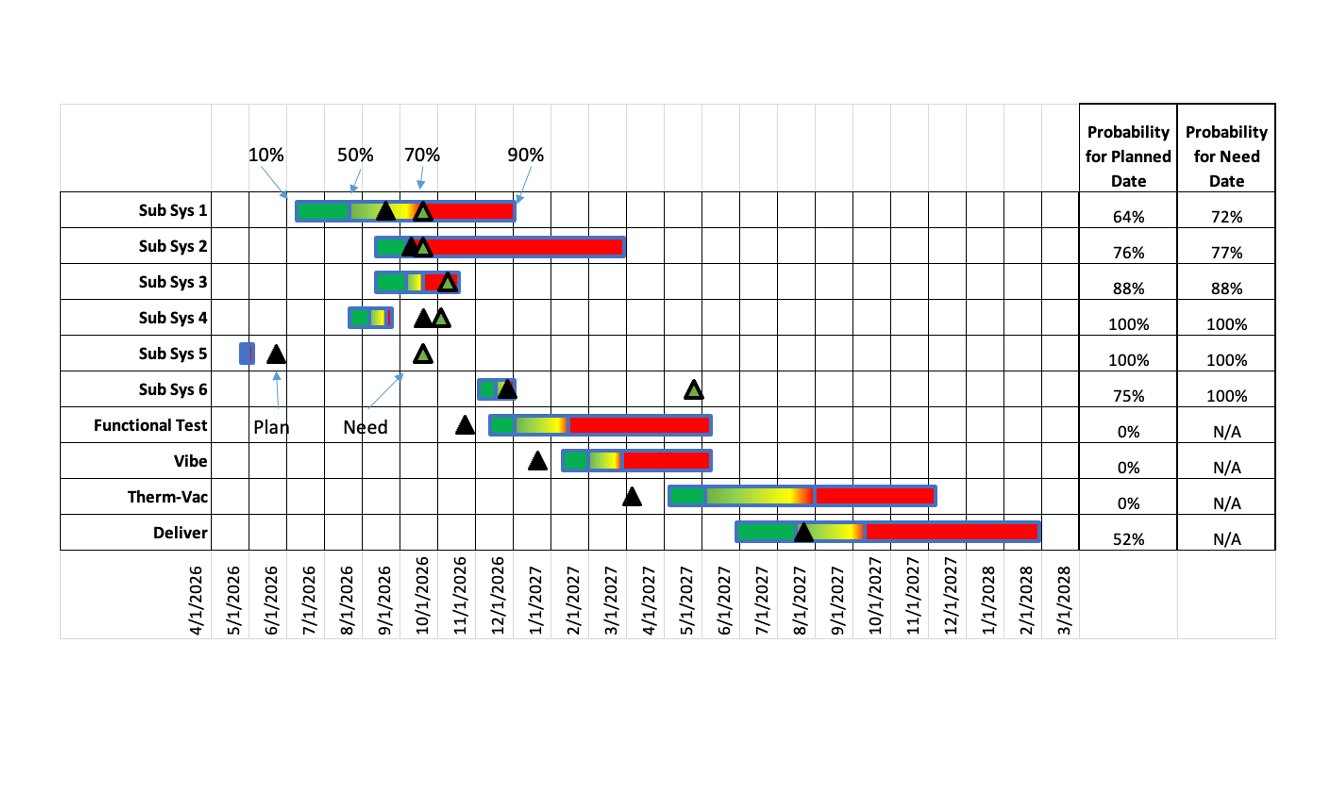
simplifying a Gantt chart
Complex Gantt charts can be hard to read. This post shows how to simplify a timeline view so the audience can quickly see where attention is needed most.

my favorite makeover (that didn’t make the book)
This client case makeover—one of our favorites that almost made it into the new book—shows how simplifying a complex forecast can turn confusion into clarity and insight.