One common piece of feedback I get after presenting on the topic of data visualization goes something like this: Wow, that was super useful. I'm never going to use pie charts again. But when it comes to the graphs, how do you actually make them look like that? I'm not Excel-savvy...help!
Pretty much everything I do is in Excel. I like to refer to it as "brute-force" Excel, because in many cases the graphing application doesn't make it so straightforward to get from plotting the data to the final product. So I thought I'd take a few minutes to walk step by step through an example to expose those who question their Excel expertise to some of my tricks.
The following example may look familiar; it's from the FlowingData Challenge earlier this year (original blog post here).
The full Excel file can be downloaded here.
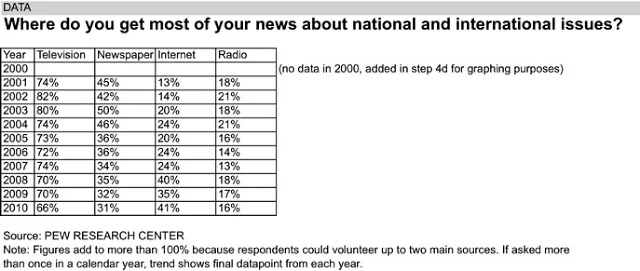
What you require most to get from Excel's original graph to the one you actually are proud to present is patience and time. You'll improve your odds of success by leaving ample time for the visualization step: don't rush this important piece, as it's what your audience sees of all your hard work!


Cole, if you haven't already, you should check out Tableau Software. It'll dramatically reduce the number of steps you have to go through to create these charts. Less time = more time for insights.
ReplyDeleteAlso, if I need to share documents, I use Dropbox. I can send you an invitation if you don't use it already.
Andy - I used Tableau briefly a couple years ago for work, but haven't since. My issue is that I'm on a Mac, and last I checked, there isn't a Mac version...Do you think that will change at some point?
ReplyDeleteA dropbox invite would be great. Thanks for the tip!
You should receive, if you haven't already, an invitation to join Dropbox.
ReplyDeleteVery useful information. Thank you.
ReplyDeleteGreat tutorial! Far too many people are clueless when it comes to displaying data visually. It seems nobody has the time to read the collected works of Edward Tufte, Stephen Few, Naomi Robbins, etc. Having simple tutorials like this are a great way to educate the masses on the visually display of data.
ReplyDeleteThis should be shared! I found this on Twitter via the amazing Jon Peltier.
@dmgerbino
I'm forwarding a link to this post to folks I work with, very well done. I'm a Tableau fan (just attended TCC2011). I heard people asking about a Mac version but it didn't sound like it was going to happen anytime soon. I can tell you it runs fine under Parallels for Mac, I'm running a beta copy of version 7.
ReplyDeleteCole, I very much like this kind of before-and-after tutorials.
ReplyDeleteIn the German speaking part of Europe there is Prof Rolf Hichert who developed a concept for Management Information Design in companies on the basis of E. Tufte´s principles. It´s called SUCCESS (Say, Unify, Condense, Check, Enable, Simplify, Structure) and I am kind of a "follower" of his ideas.
Here is a link to an example in which he does also a before-and-after exercise with a for a standard BI software:
http://www.hichert.com/downloads/success/vorher-nachher/Beispiel-1_Qlikview_before-after_2011-08-06.pdf
Regarding Tableau: I tested it with my team some time ago and we found it a useful analysis tool for the "powerusers". Providing Stephen-Few-compliant graphical pivoting.
ReplyDeleteWe finally decided against it when it comes to final graphics ending up in reports. We didn't find enough flexibility regarding the layout options. Tableau was more like a knife or sword when we needed a scalpel.
Markus, Switzerland
Awesome post, Cole. This should be standard reading for anyone who uses Excel to present. Thanks
ReplyDeleteCole, this is a nice tutorial.
ReplyDeleteI run windows on my mac virtually just to run Tableau. Takes a while to launch windows, but once it's running it's just fine.
Hi Cole, I suspect that you could record a macro to automate most of these steps. That should allow you to get rid of some of the boring repetition. I'm on a Mac as well, but this laptop doesn't have Excel on it, so I can't verify. It's worth looking into, at the very least!
ReplyDeleteGreat idea for a lecture! I almost wish to open Excel and play with it now.
ReplyDeleteShould keep the points on the x axis where the lines cross, i.e., where internet crosses radio and where internet crosses newspaper, else nice job
ReplyDeleteI like it and learned a lot. As I thought about your logic, one more possibility occurred to me. I think I would change the before and after date labels with just a before label. This label would be a down arrow or up arrow followed by the change amount. For example, "Television [down arrow] 8%"
ReplyDeleteI would probably have shown the internet curve as a lineand the other three as bars OR vice versa
ReplyDeleteDuncan