how many words should I put on my slides?

As the workplace shifts to more remote communication, a question we’ve been receiving frequently in our virtual workshops is “How many words should I put on my slides?”
The answer? It depends on how your audience is consuming the information. If you’re sharing your data live—whether over video conference or in person—that typically calls for minimal text. You can provide the words verbally, which enables your audience to focus on what you’re saying rather than trying to read your slides. If you’re not presenting live, however, you’ll need more words on the page because your audience is left to understand the data without you there to help them interpret it.
In a perfect world, this would call for two distinct deliverables: a presentation with sparse slides and a written report containing more detailed content. In reality, this rarely happens. Because of time constraints, we often create a “slideument”—it’s part presentation, part written report, and not exactly meeting the needs of either scenario. This term was originally coined by authors Nancy Duarte (Slide:ology) and Garr Reynolds (Presentation Zen), who have written about this unfortunately all-too-common communication in the workplace. Below are some example slideuments.

Source: Google image search for “slideument”
In this post, I’ll discuss some tips for avoiding slideument, with an example excerpted from storytelling with data: Let’s Practice!
Imagine you work as an analyst for a large healthcare system with medical centers in several states. Your analysis has uncovered a trend—a recent rise in patients’ diabetes rates and a forecast showing a continued trajectory—which you believe warrants a closer look to assess whether additional resources are needed. You’ve been directed to prepare one slide on your findings that will be passed along to administrators, first in a live meeting, and then emailed around for those who weren’t able to attend. The data used in your analysis is visualized in the graph below.
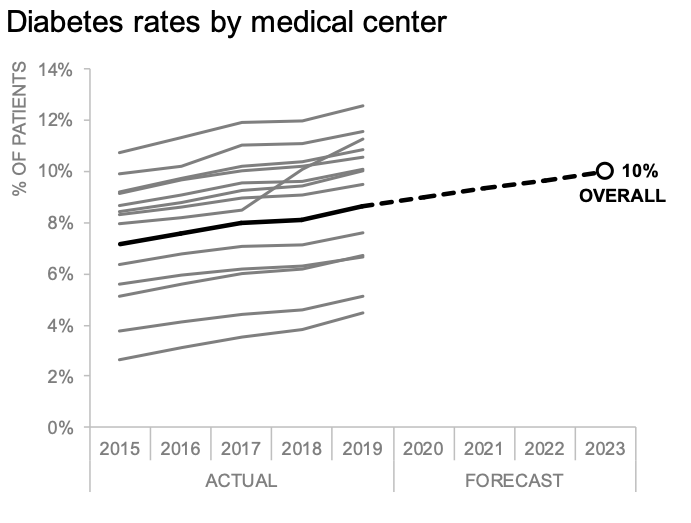
Assume we want to focus our audience’s attention to the projected rise in diabetes between 2020-2023 and prompt discussion on hiring additional staff to remain accredited within national standards. How might we design a communication that meets both the needs of a live meeting and an asynchronous reader? One approach: first design a single summary slide for those who might miss the meeting. Then adapt it—using animation—so that in the live setting, the presenter can highlight just a few components at a time. The beauty of this method is that it allows the speaker to lead the audience through a data-driven story by controlling the amount of detail shown at any given time but ends in a fully annotated view that can be distributed.
My single-slide summary might look like the following visual.

For the live meeting, I’ll transform it. While the amount of words on my summary slide might be fine for an audience to consume on their own, they could distract on the screen. When we attempt to use visuals like this in our presentations, many people will tune us out as they read. We’ll explore this topic further during our upcoming live event mode & method (open to premium subscribers).
To keep my audience’s attention in a live setting, I’ll break this slide into several components and talk to one piece at a time. I used the SWD community exercise storyboard your project to construct the following narrative flow.
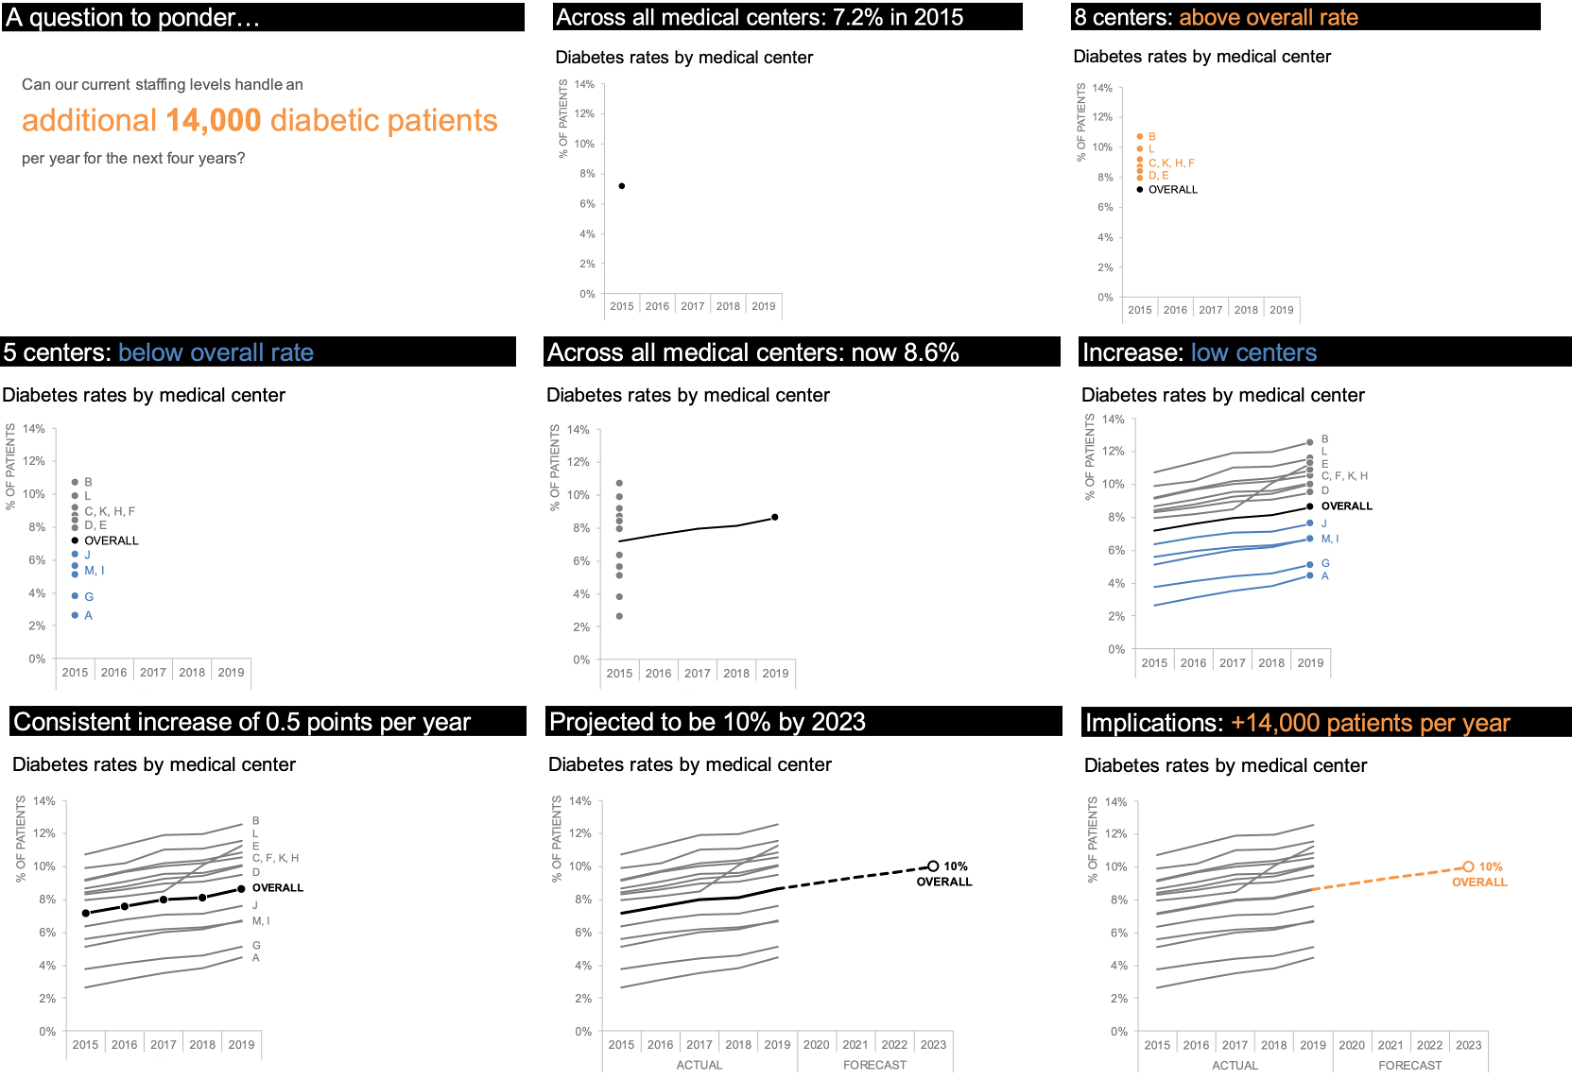
This approach does take time, but it’s time well invested in ensuring that the hard work I do behind the scenes to find the interesting things doesn’t get lost when I share my findings. Premium subscribers can watch how I narrate these slides for the live meeting in the learning video, differentiate between live and standalone stories.
The next time you’re struggling with how many words to put on your slides, pause and reflect on how you’ll be delivering those slides and design accordingly. Be sure to check out my follow-up post: how white text boxes in PowerPoint can improve your virtual presentations.