different graphs enable different things
Today’s post is the third installment of this series: five questions to ask yourself when designing a graph for explanatory purposes. First, we looked at the power of decluttering; then, in yesterday’s post, we applied color thoughtfully:

Today’s question is all about first impressions.
QUESTION 3: What’s easiest to see in my graph?
Data can be visualized many different ways, creating an often daunting task to select the best chart to use. We also sometimes complicate our audience’s experience, packing too much information into a single graph, in the hopes that it will answer every possible question. Instead of making the Swiss Army Knife of charts, we might instead create different views of the same data, examine what each iteration allows a viewer to see, and then decide which version(s) to share with our audience.
To illustrate, let’s use one of our iterations from yesterday’s post (shown below). While a definite improvement over the original, I’d argue that we’d be remiss to use this view because there are some nuances that this chart isn’t revealing.

What if we split up the data into two graphs? Recall that we would revisit how to display the Total trend more effectively than layering it onto the bars. Let’s instead use a separate line chart for the decline over time:

One benefit of showing just one component at a time: now I have space to add context through supporting annotation (recall the clunky blue arrows in the original graph that attempted to serve this purpose).

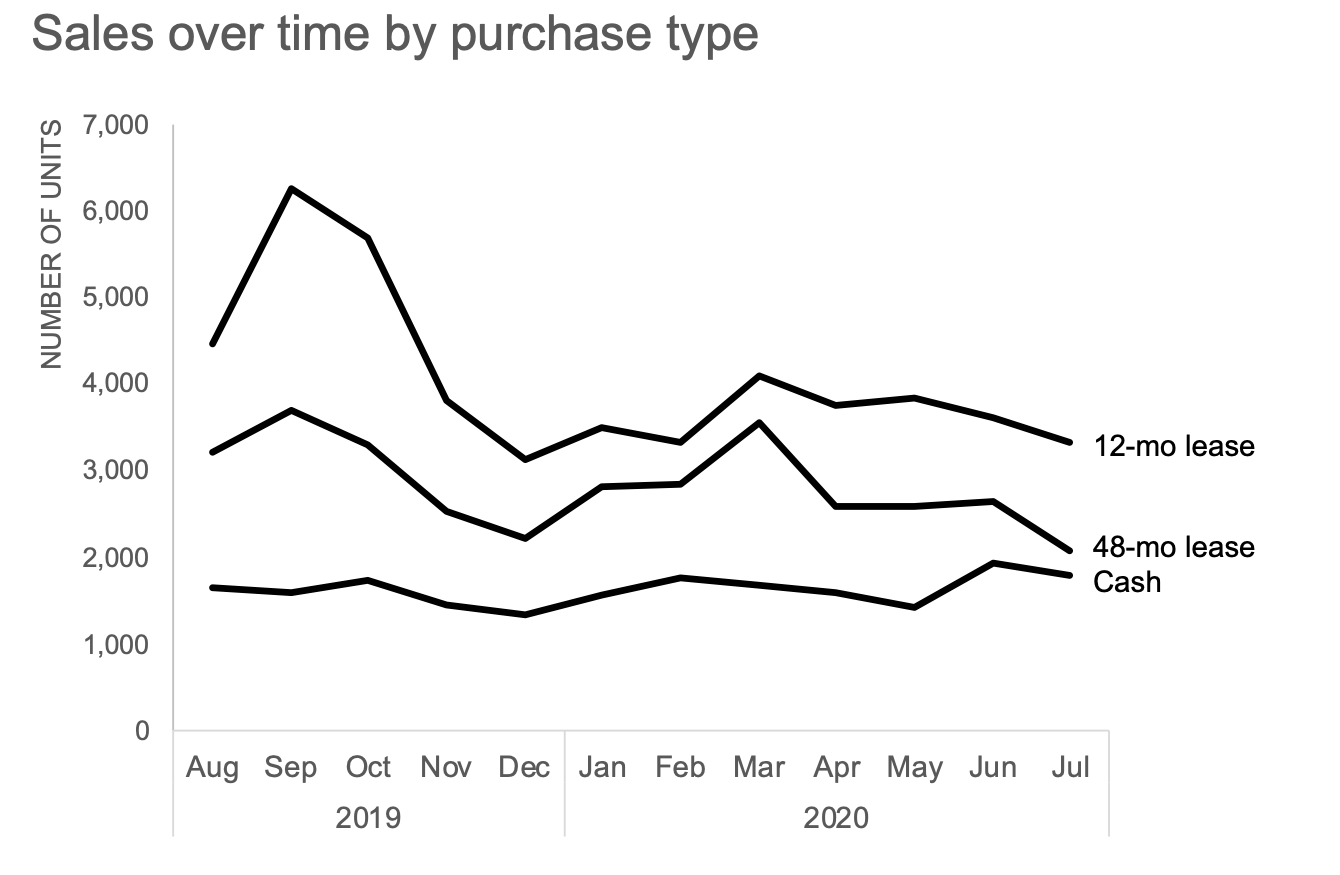
Next, let’s explore a few different ways we could visualize the breakdown of purchase types. What’s easiest in the existing stacked bar is to examine the trend for Cash because it’s at the bottom allowing for a common baseline at the x-axis. However, as we move up the stack, comparing the 12-month lease series over time is a harder task, because there’s no consistent baseline any longer.

If I want my audience to compare each series individually, I might unstack and show the data as a line graph:
If the month-to-month variations are less important, I might consider plotting only the first and final months with a slopegraph to get a quick sense of the change:

As another alternative, if the relative composition is what I want to focus on, I could opt for a 100% stacked horizontal bar:

I’ve created four different ways to visualize the purchase type breakdown, as shown below. While these certainly aren’t the only four options, I can now evaluate each iteration for what it allows my audience to easily see.

Which view would I choose? Move onto the next post—my answer depends on our fourth question. For more data storytelling inspiration, take a spin around our newly launched makeover page. If these are skills you need to build within your organization, learn more about our custom workshops and how the SWD can teach and transform using your own internal examples.