
#SWDchallenge: whip up a waterfall
I’m proud to call the Pacific Northwest of the United States my home. Here we have rocky beaches, hidden waterways, uninhabited islands, and mountains as far as the eye can see. Which, admittedly, isn't very far through the fog most times of the year. I hike in Washington’s mountain ranges to take advantage of the summer weather. Hikes with a waterfall destination are among my favorites, and I live in the right spot for it: Washington is home to over 2,900 waterfalls, including the tallest waterfall in the continental US!
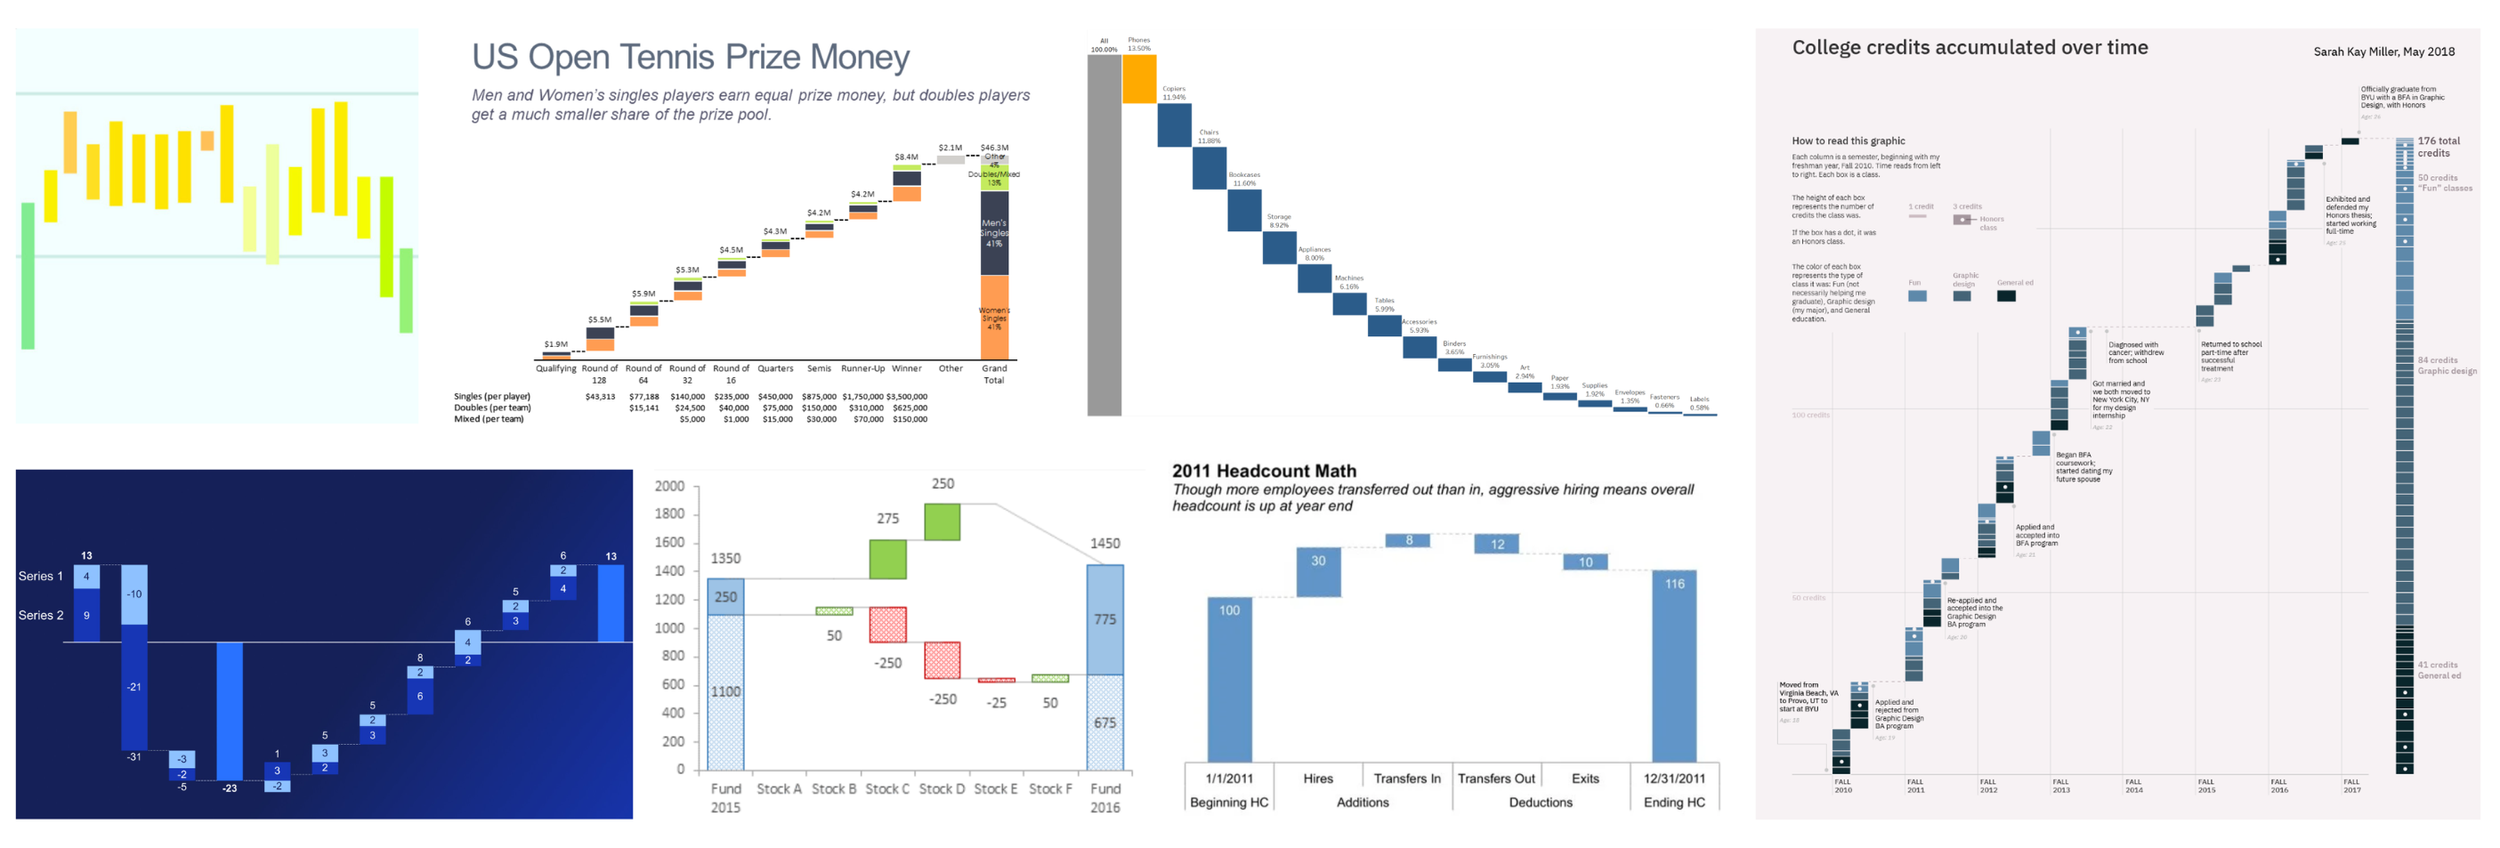
Being in nature is inspiring, and a recent waterfall hike got me thinking about one of my favorite types of charts: the waterfall chart. These are such powerful tools for storytelling, because they show where you started, what changed along the way, and where you ended up.
We challenged our community with waterfall charts many moons ago, but I’d love a fresh look. I have historically used waterfalls for sales breakdowns or cause-of-change analyses, and they also work for tracking HR headcounts, subscription data, or even score changes over the course of a sports match.
Waterfall charts work especially well for live walkthroughs, where you can spend time discussing important bars in the middle section of the chart, but I also love the white-space that they provide in written communications. I’m curious what all the different use cases are for waterfall charts, so that is your challenge this month.
The challenge
Share a waterfall chart. You can use your own data, publicly available data, or simply practice with a classic SWD example. As always, be sure to anonymize any data that can’t be shared publicly.
For the uninitiated, I’ve gathered resources on how to build a waterfall chart and some design considerations in the related resources section below. Your waterfall communication can be serious or for fun, tell whatever story inspires you!
Share your waterfall chart story here by August 31st at 5PM PT. If there is any specific feedback or input that you would find helpful, include that detail in your commentary.
Related resources
Here are some additional resources to help you build a waterfall chart.
SWD chart guide: what is a waterfall?
SWD video tutorial: Make waterfall charts in Excel (the EASY way!)
SWD video: waterfall presentation example
Datawrapper article: What to consider when creating waterfall charts
Microsoft PowerBI article: Waterfall charts in PowerBI
Analyst Academy video: When to use a waterfall chart (and how to make one)
