so what?
"What is the point?" This is a question that comes up often in my workshops when we are looking at graphs and discussing how they can be improved. Other flavors of this same basic question take the form: "What is the message?", "What is the story here?" or the concise, "So what?"
Too often, when we communicate with data, we don't make our point clear. We leave our audience guessing. Your audience should never have to guess what message you want them to know. The onus is on the person communicating the information (you!) to make that clear.
I've been thinking a lot about story lately (in preparation for my recent Tapestry presentation and also for an upcoming project). The word "story" has become a buzzword. Everyone wants to "tell a story with data." But very often, when we use this phrase, we don't really mean story. We mean what I mentioned above—the point, the key takeaway, the so what?
I've started to draw a distinction when I talk about story into two types: story-with-a-lower-case-'s' and Story-with-a-capital-'S.' The latter is Story in the real sense of the word. A Story has key critical components—there is a structure, a shape—it has a plot, a rising action, a point of climax where tensions reach their highest, a falling action, and a resolution. (Related note, Jon Schwabish is currently running a series of blog posts on story—the capital S kind—that starts off with his thoughts on the question what is Story?). But I veer slightly off track.
Today, my focus is on story-with-a-lower-case-'s,' which, in my view, is the minimum level of "story" when you are communicating for explanatory purposes with data. It's not really story at all, but rather the point—the so what? For every graph you show, for every slide you show: make the point clear to your audience. This can be through your spoken words in a live meeting or presentation, or physically written down on the page if the document is meant to stand on its own. Don't assume two people looking at the same graph or slide will interpret it the same. Which means if there is a key takeaway—which there absolutely should be if you're at the point of communicating the information—you need to make that point clearly to your audience. Put it into words!
Speaking of words, in slideware-land (PowerPoint, Keynote, and similar), the title bar on each slide is precious real estate (this is similar to a section heading in a written report). This is the first thing your audience encounters when they see your slide. Too often we underutilize this space with a descriptive title. Think about instead using this precious real estate for an active title. Put your key takeaway—the so what?—there. It makes sense when we stop and think about it: use your title strategically. (If you need more evidence than common sense, check out Michelle Borkin's Tapestry talk where she demonstrates the importance of effective titles and also covers some other interesting learnings for communicating with data from her studies at Northeastern University.)
Let's check out the importance of having a clear so what? and the impact effective titling can have through an example. The following is a visual I discussed in a conference presentation recently:

I originally came across this graphic when combing through recent posts on viz.wtf (an entertaining potpourri of what not to do when visualizing data). I know, I know—it's not really data visualization at all, just a visual made to look infographic-y with some numbers in it. Being clear on the so what? can help us better understand how to best visualize this data.
I did a little digging, and it turns out that the graphic above was originally part of an article in The Daily Texan:

Note the title: "DWI rates increase in months following departure of Uber and Lyft." It turns out there already was an effective title making the so what? clear.
Now that we know what point we're trying to make, we can visualize the data to make this point more effectively. As a related note, these numbers don't actually appear to be DWI rates, as described in the original graphic. A little research reveals this data is likely the number of DWI arrests. I'll make that clear in the title and also spell out what DWI is the first time it's used, in case anyone in my audience is unfamiliar. If we want to show an increase over time, a line graph could do that effectively:

The line graph allows us to clearly see the trend: decreasing DWIs January through April and increasing April forward. But remember that part about making my so what? clear via words? In the above, my audience is left to interpret the data themselves and draw their own conclusions. If I'm the one presenting the data, I should assist in that process. In the following, I've added a subtitle making the takeaway clear. Also, there was an important event—the departure of Uber and Lyft—which I've annotated on the graph directly for context.
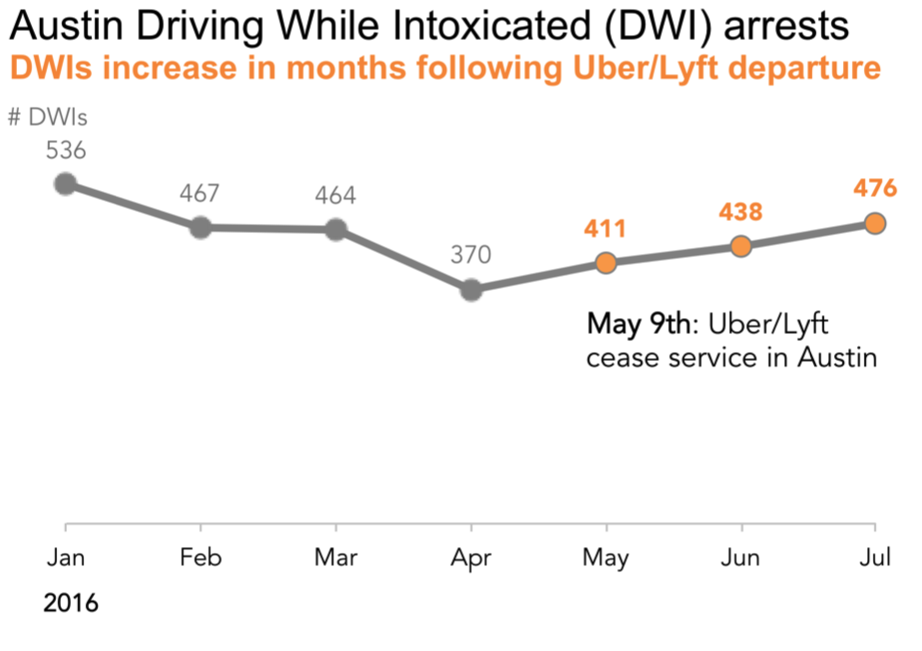
I put the main point into words via the subtitle. I did my audience the added bonus of tying these words visually to the relevant data points through consistent use of color. This means that after my audience reads the words, they know exactly where to look in the graph for evidence of the point that is being made. If I were showing this graph on a slide, I could have the takeaway "DWIs increase in the months following Uber and Lyft departures" as the slide title (and remove it from the subtitle, leaving just the main title on the graph).
Bottom line: make your so what? clear via words on every graph and every slide. Don't leave your audience guessing, or leave your important takeaway being known to chance!