how to do it in Excel: emphasizing a data point
Elevate your skills with our on-demand learning course
Are you looking to create outstanding graphs and slides? Check out our new on-demand video course behind the slides: good to great PowerPoint presentations. In this comprehensive course, you'll gain lifetime access to 5 engaging learning modules featuring 30+ detailed lessons with over 75 minutes of high-quality video content. Learn at your own pace and master the skills you need to take your PowerPoint presentations to the next level. Enroll today!

Today’s post is a tactical one: how to highlight a data point in Excel.
When we craft visualizations for explanatory purposes—that is, when there’s a specific finding or recommendation that we want to communicate to someone specific—our goal is to drive action. In those cases, our visuals should emphasize what’s interesting in the data and what requires attention. Highlighting key points in our graph is an important step in creating successful explanatory communications.
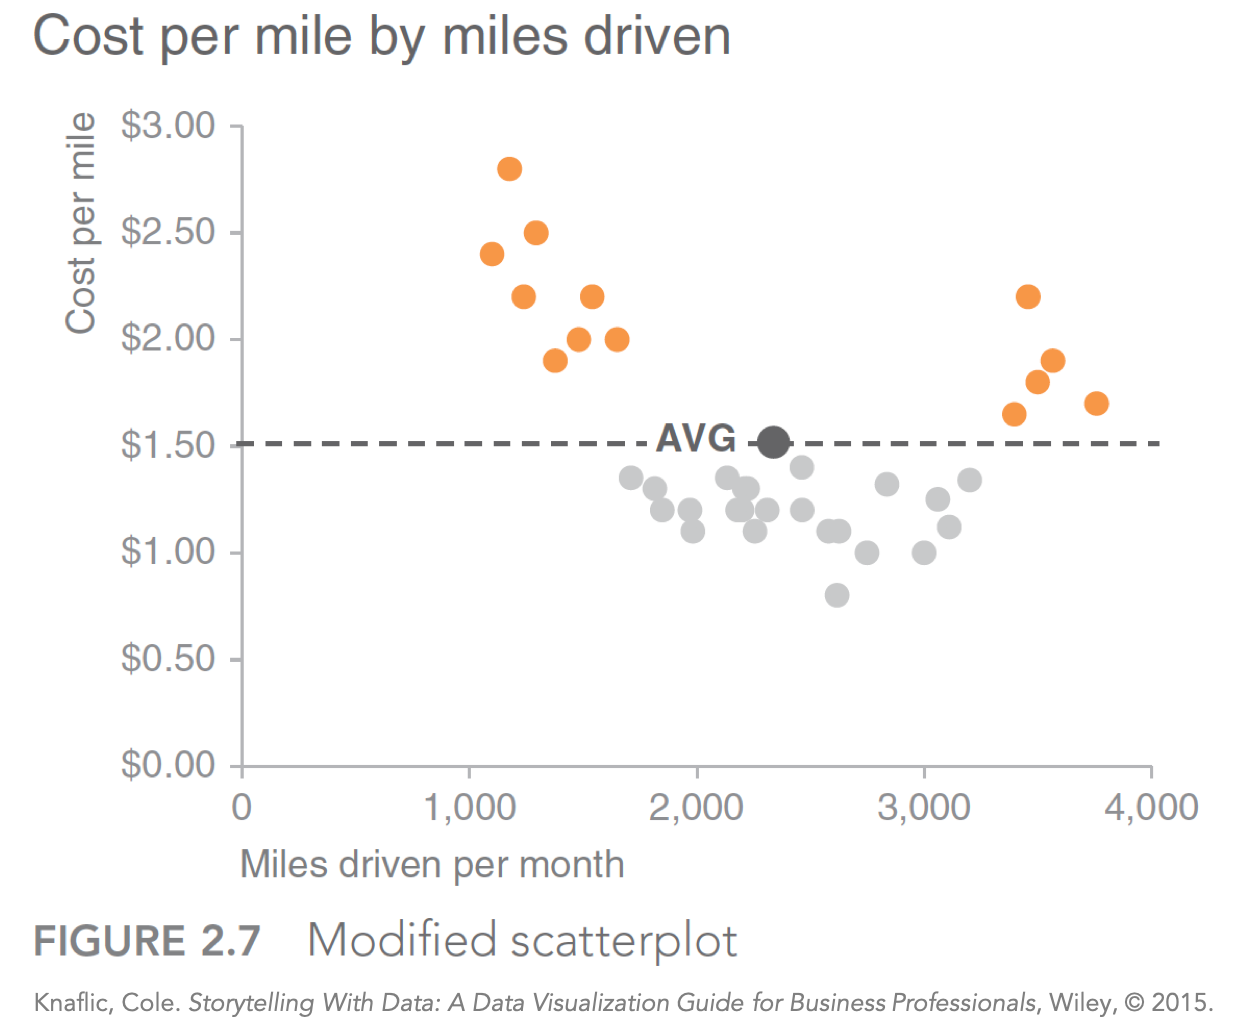
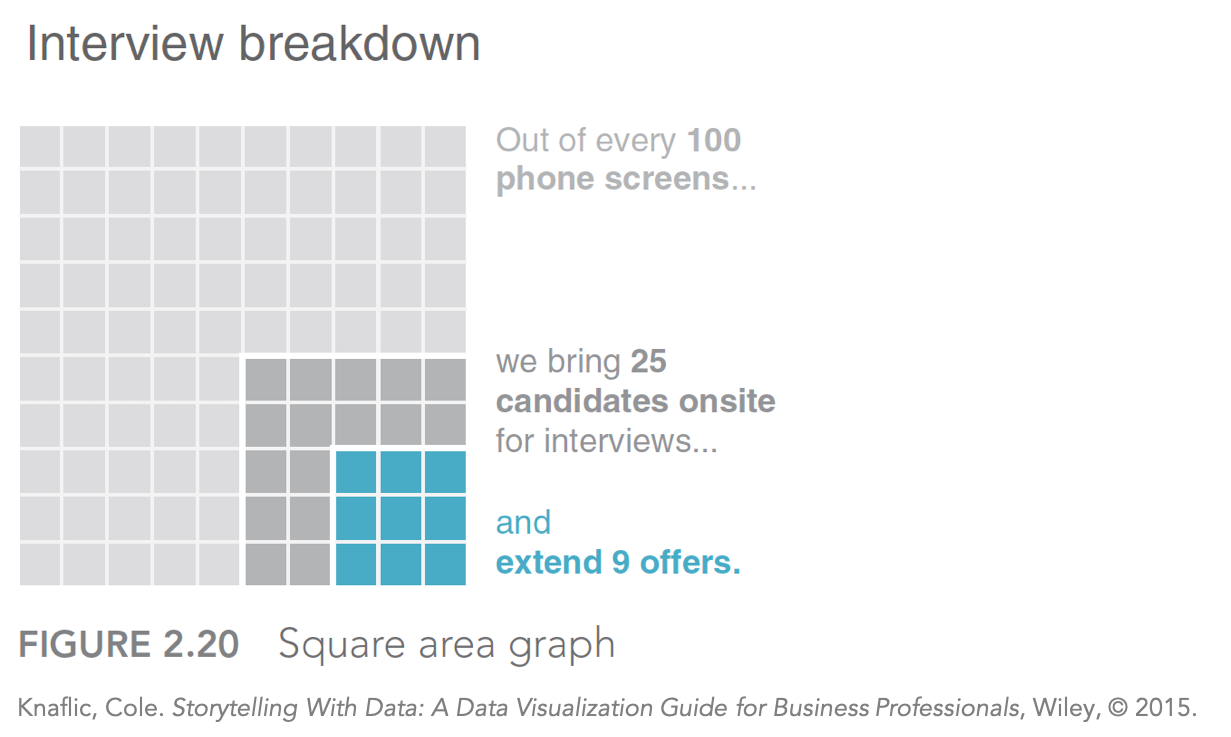
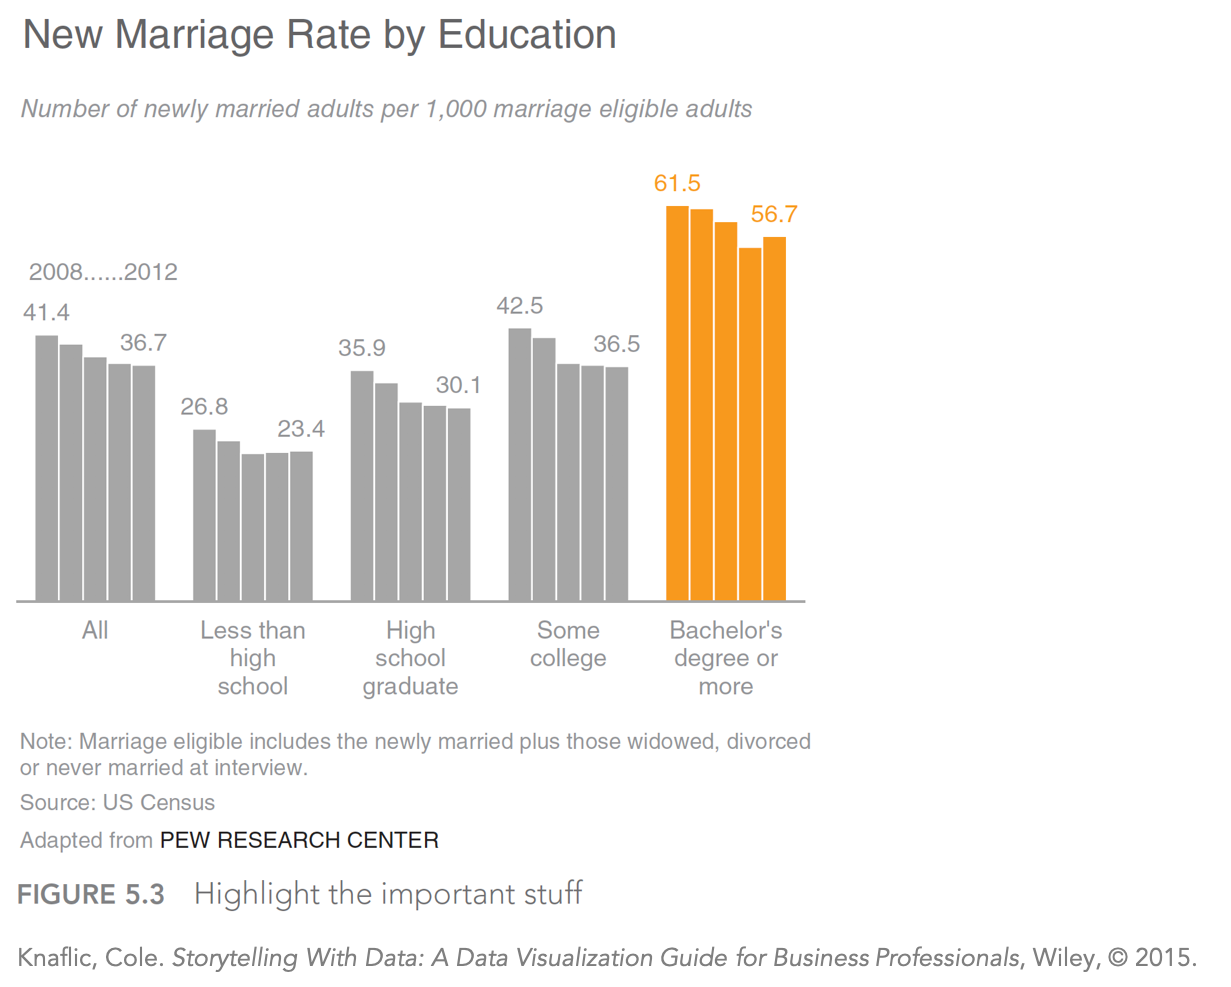
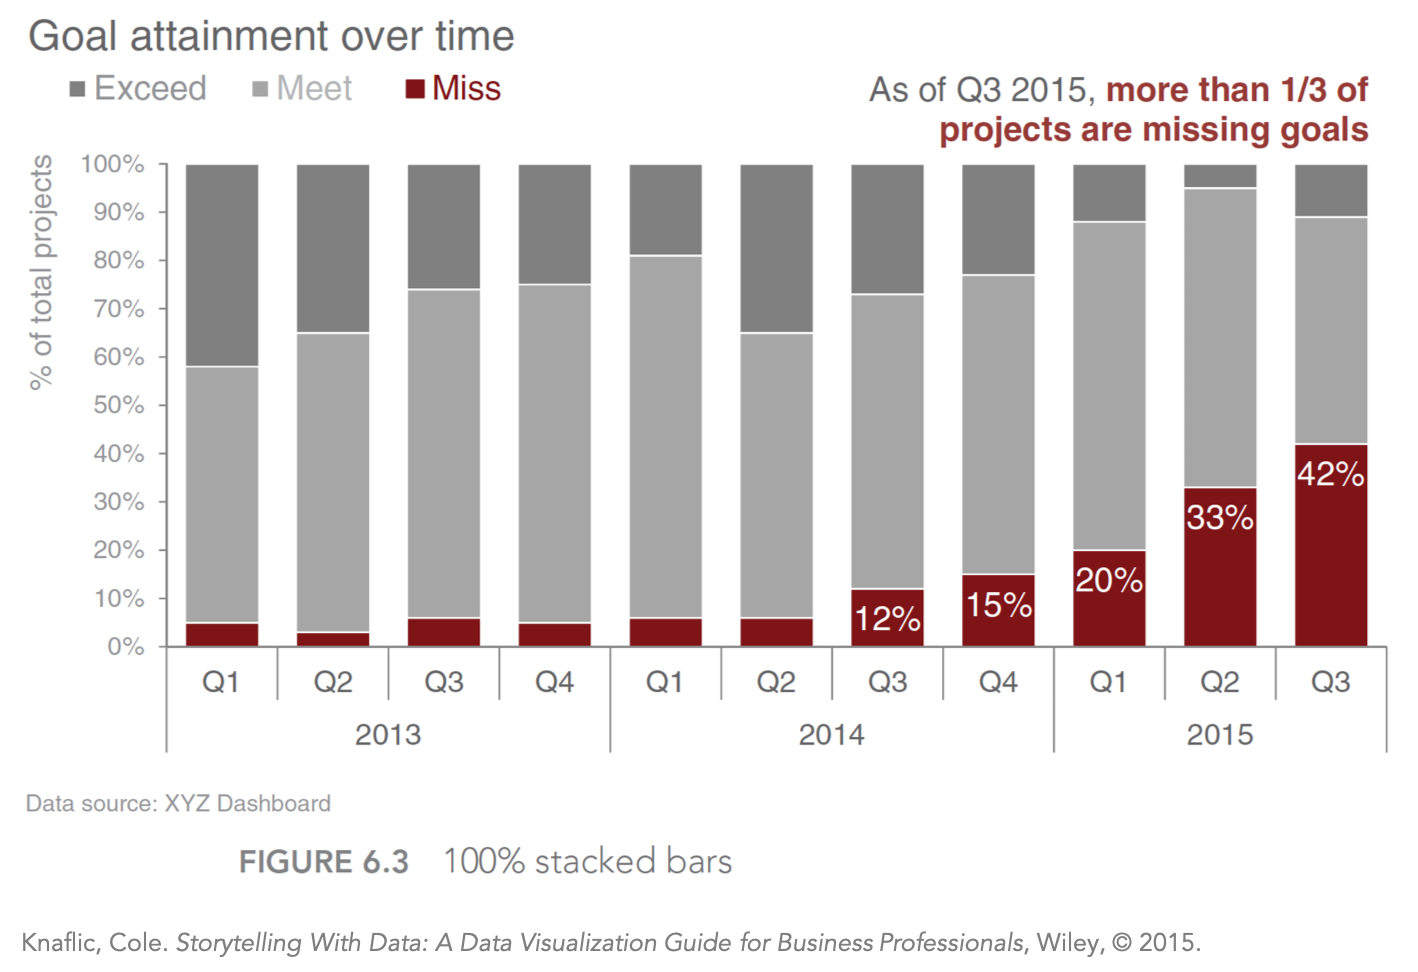
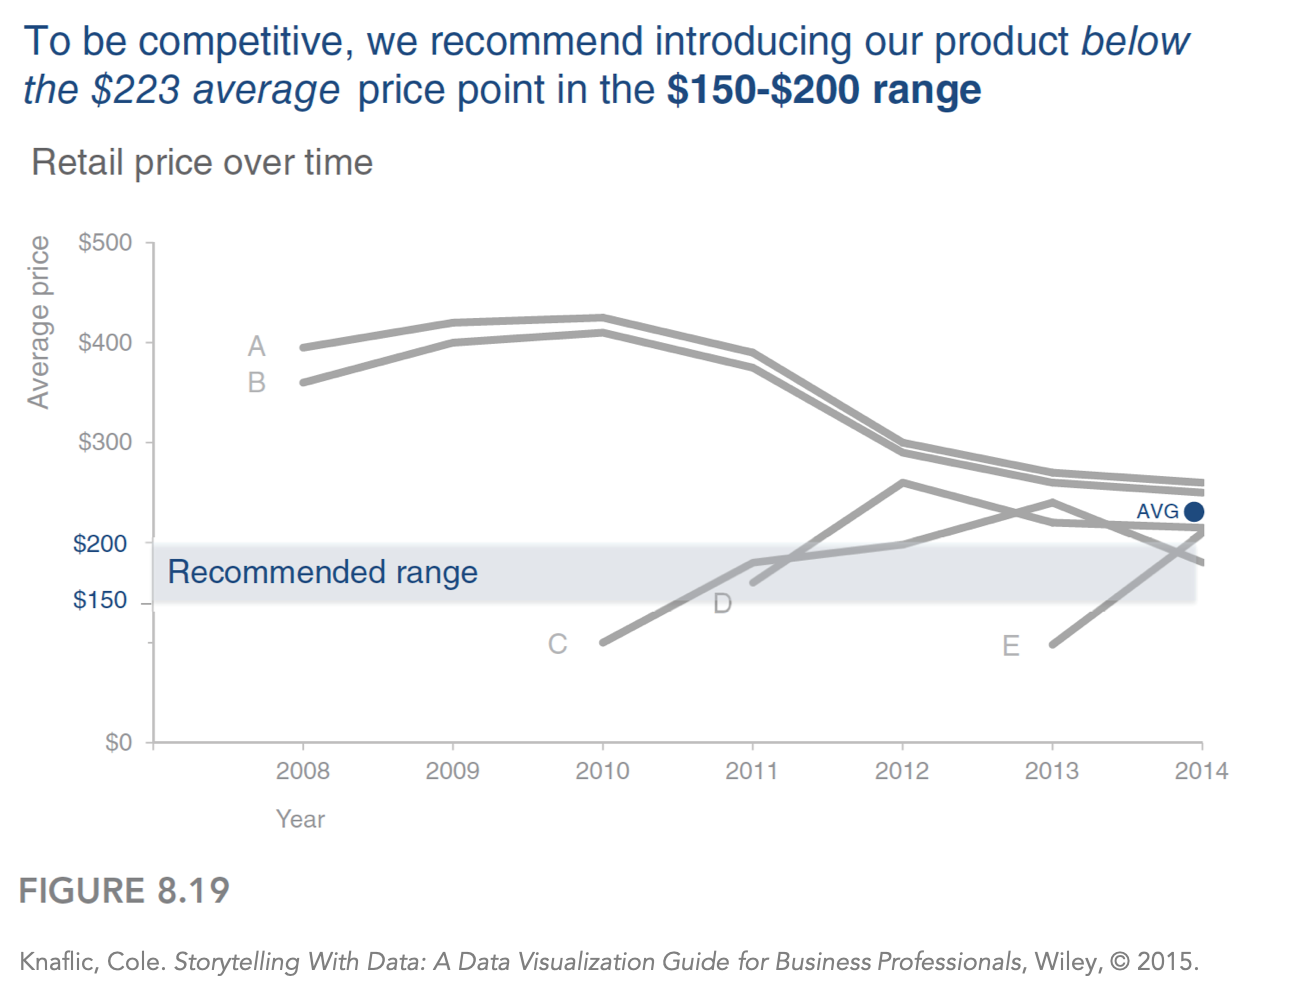
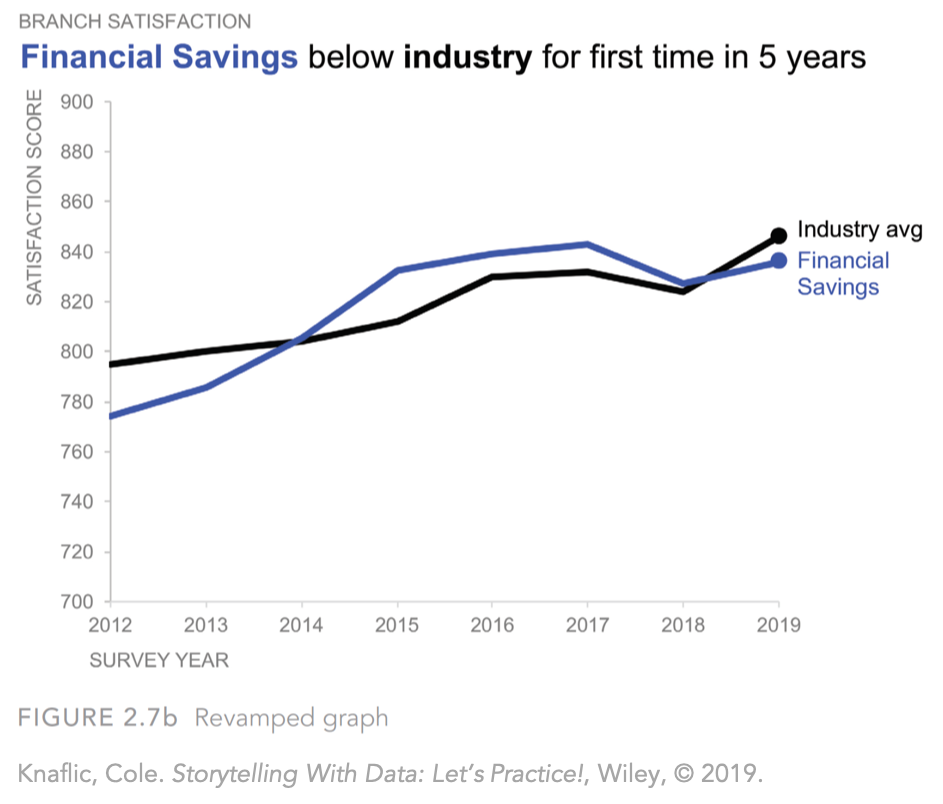
Here are some charts that use this technique effectively, making it clear where an audience is meant to focus. You can check out many more examples by using the Discover feature in the SWD community.
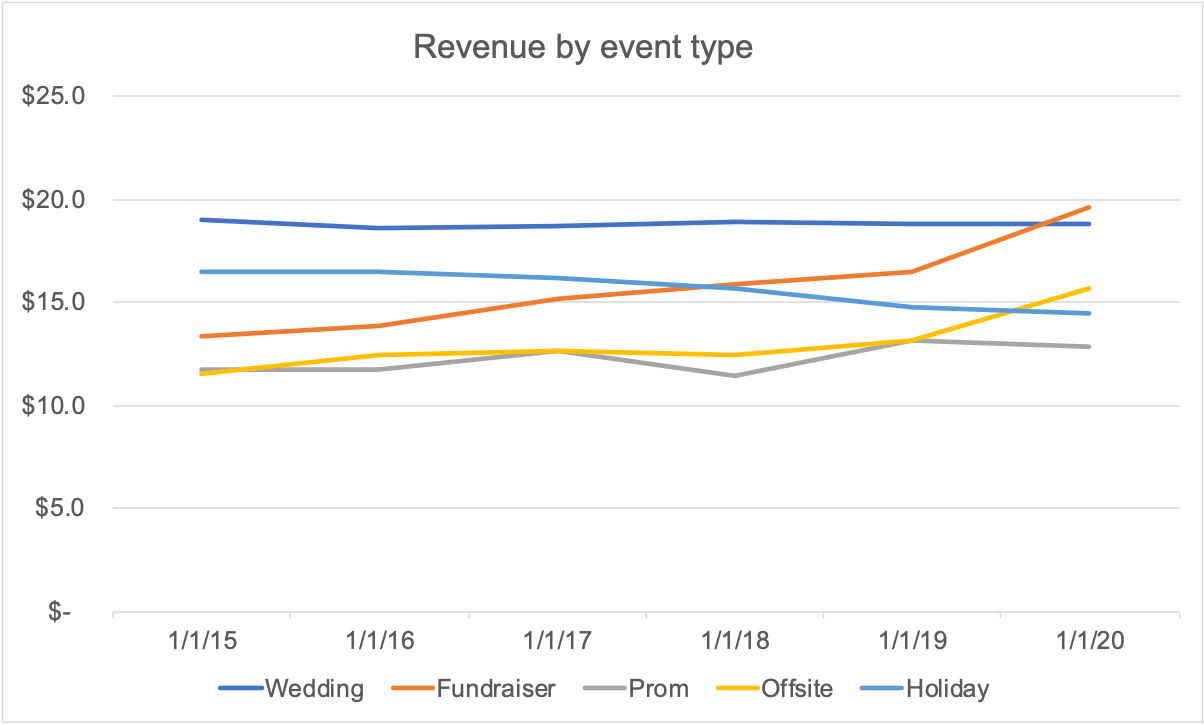
Let’s get right to how to accomplish this in Excel. The example we’ll be working with today is a graph that shows average revenue by event type for a venue that hosts various public functions. You can download the accompanying data file to follow along with these steps.
Here’s our starting point, which Excel created by default.
First, I'm going to create a clean, uncluttered version of this graph. (You can reference this prior post for steps to reformat Excel graphs.)
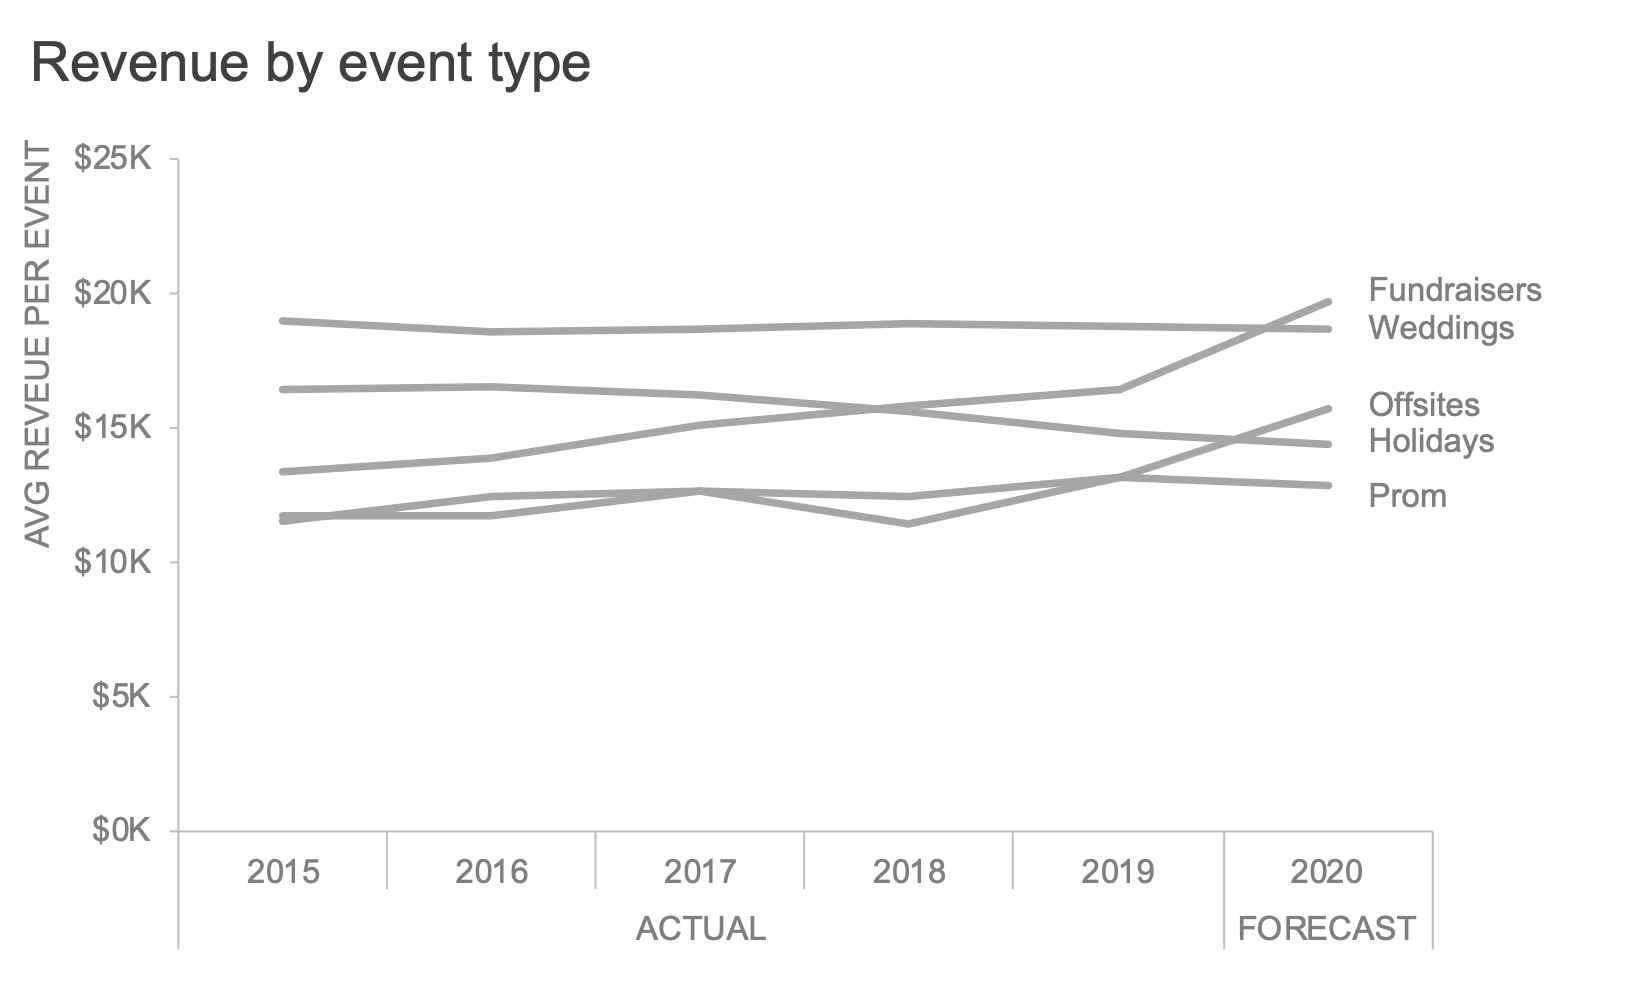
Let’s assume my audience is a marketing leader who’s interested in knowing which event type is expected to have the highest average revenue in the coming year. Since the answer is “Fundraisers,” I’ll direct attention to the 2020 forecast for that event type with these steps:
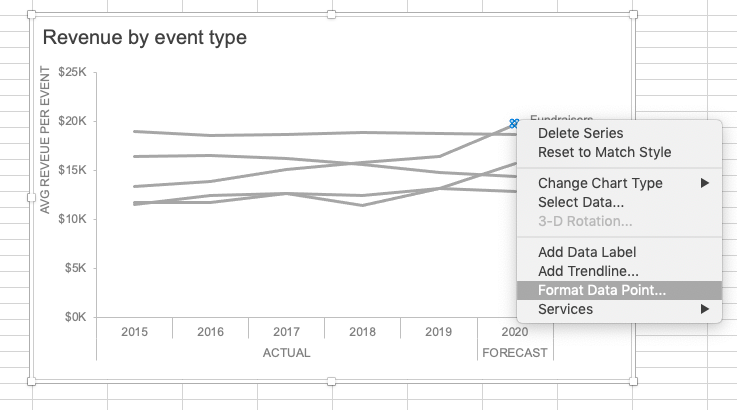
Click once anywhere on the Fundraisers line, then click on just the 2020 data point. Right click on the selected point and choose Format Data Point.
2. The Format Data Point menu opens. Under the Fill & Line tab (with the paint bucket icon), click on the button that says “Marker,” and then navigate to Marker Options. Click the Built-in option, then choose a filled circle in the drop-down Type menu. I’ll also adjust the size to 9 (the size you choose should depend on the existing thickness of your lines and your individual needs for using the marker as emphasis).

3. In the Fill menu, I can adjust the color by selecting my preferred choice under Solid fill:

4. I’ll also adjust the outline color in the Border menu below it. I chose no line, but this is my personal preference.

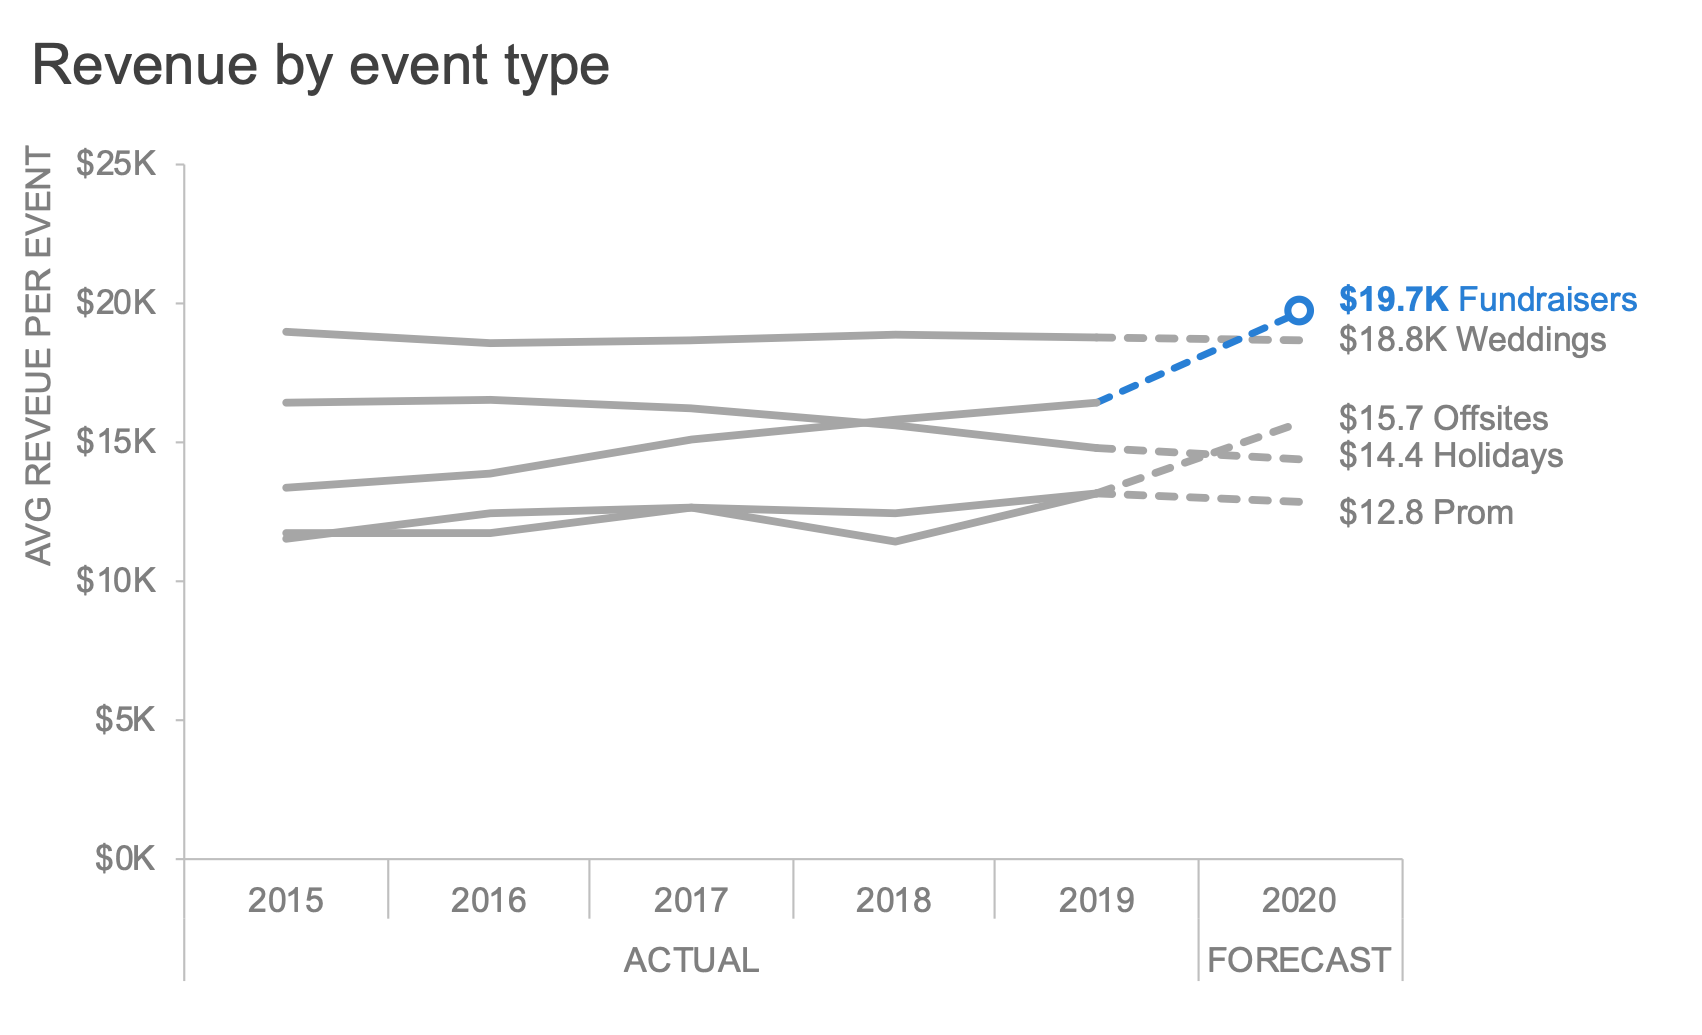
My resulting visual looks like this:

Even if you just quickly glance at this graph, notice how your eyes are drawn to that blue dot. By adding and formatting this particular data point, I’ve made it clear to my audience that the Fundraiser value in 2020 is where I want them to look.
Since the 2020 data point is a forecast, I’d want to visually distinguish it from actual data by varying the line style (making it dotted instead of solid) and the marker style (making it open rather than filled). I’ll also include the numeric data labels for specificity’s sake.
Here’s how we can apply those changes, as we continue to refine our graph:
5. To vary the line style, highlight the data point of interest the same way you did earlier in Step 1. Right-click and choose Format Data Point.
6. In the Fill & Line tab again, instead of clicking on Marker, click into the Line menu, where you can adjust the various settings of the line immediately preceding the data point. To achieve the effect in my example above, my selections are a solid blue line with a width of 2.5 pt and a Dash type of Square dot. You can follow these same steps for the other event types in the graph as well so that all of the lines for 2020 are dashed to indicate a forecast (without changing the color to blue).

7. To add the numeric labels, I’m opting to include them as text boxes so that I have greater control over the formatting. You can read more about the considerations for text vs embedded labels in this prior post.

These formatting changes require a bit of extra effort, but they make your charts far more effective. Don’t assume that your audience knows where to look in your visuals—make that task easier for them through your design choices.

But wait…there’s more! What about all the other data? Isn’t that interesting to the audience? It absolutely could be—I invite you to practice how you’d approach this task in the community exercise emphasize multiple takeaways. You can also check out how I’d walk my audience through a story in the video so what? using story to drive action (open to premium subscribers).
More Excel how-to’s:
For better bar charts, adjust the gap width
To depict a range of values, add a shaded band
To create a frame of reference, embed a vertical line
To show a distribution of data, create a dotplot
For cleaner alignment, put graph elements directly in cells
To have more control over data label formatting, embed labels into your graphs
To make a stellar line graph, add thoughtful design elements (available to premium subscribers)