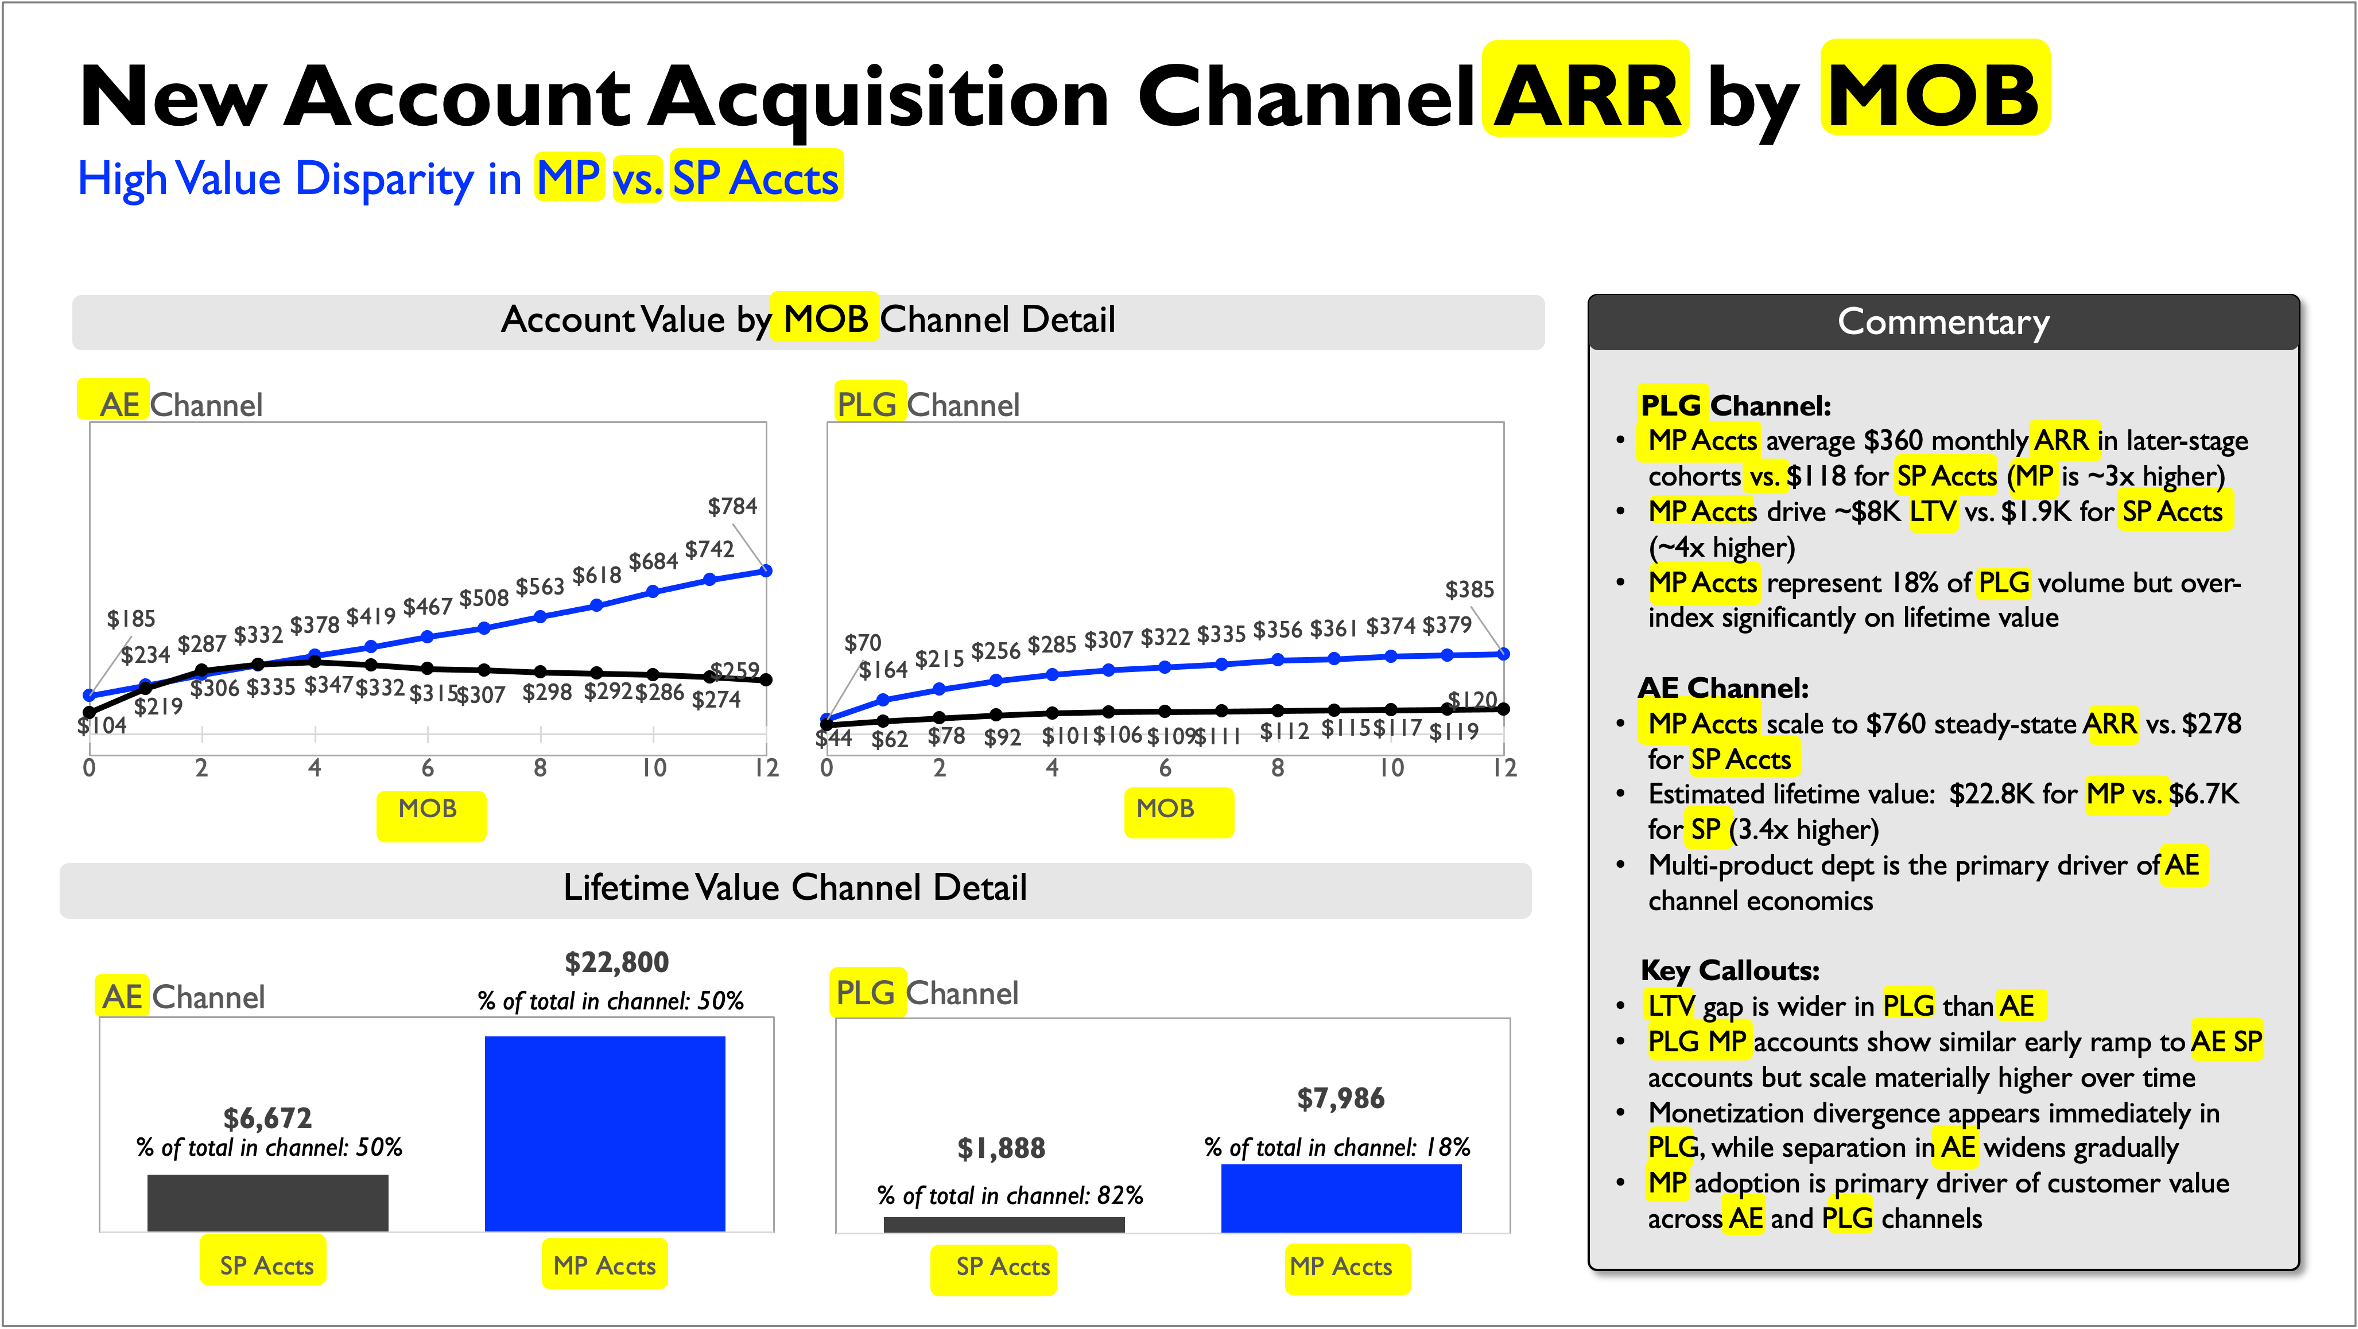
translate for your audience
When slides are full of acronyms and abbreviations, the key insight can get buried. This makeover illustrates the importance of translating jargon and focusing the visuals so the audience can quickly see what matters.
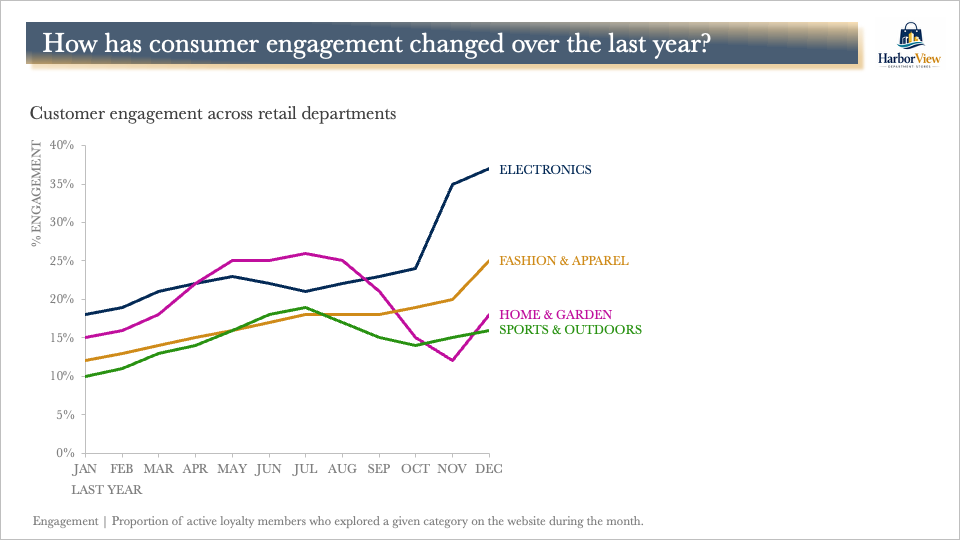
be careful using questions as slide titles
Posing questions as slide titles can feel interactive, but they can create unintended problems for your audience. Learn how clearly stated takeaway titles help focus attention on what matters and support better discussion and decision-making.
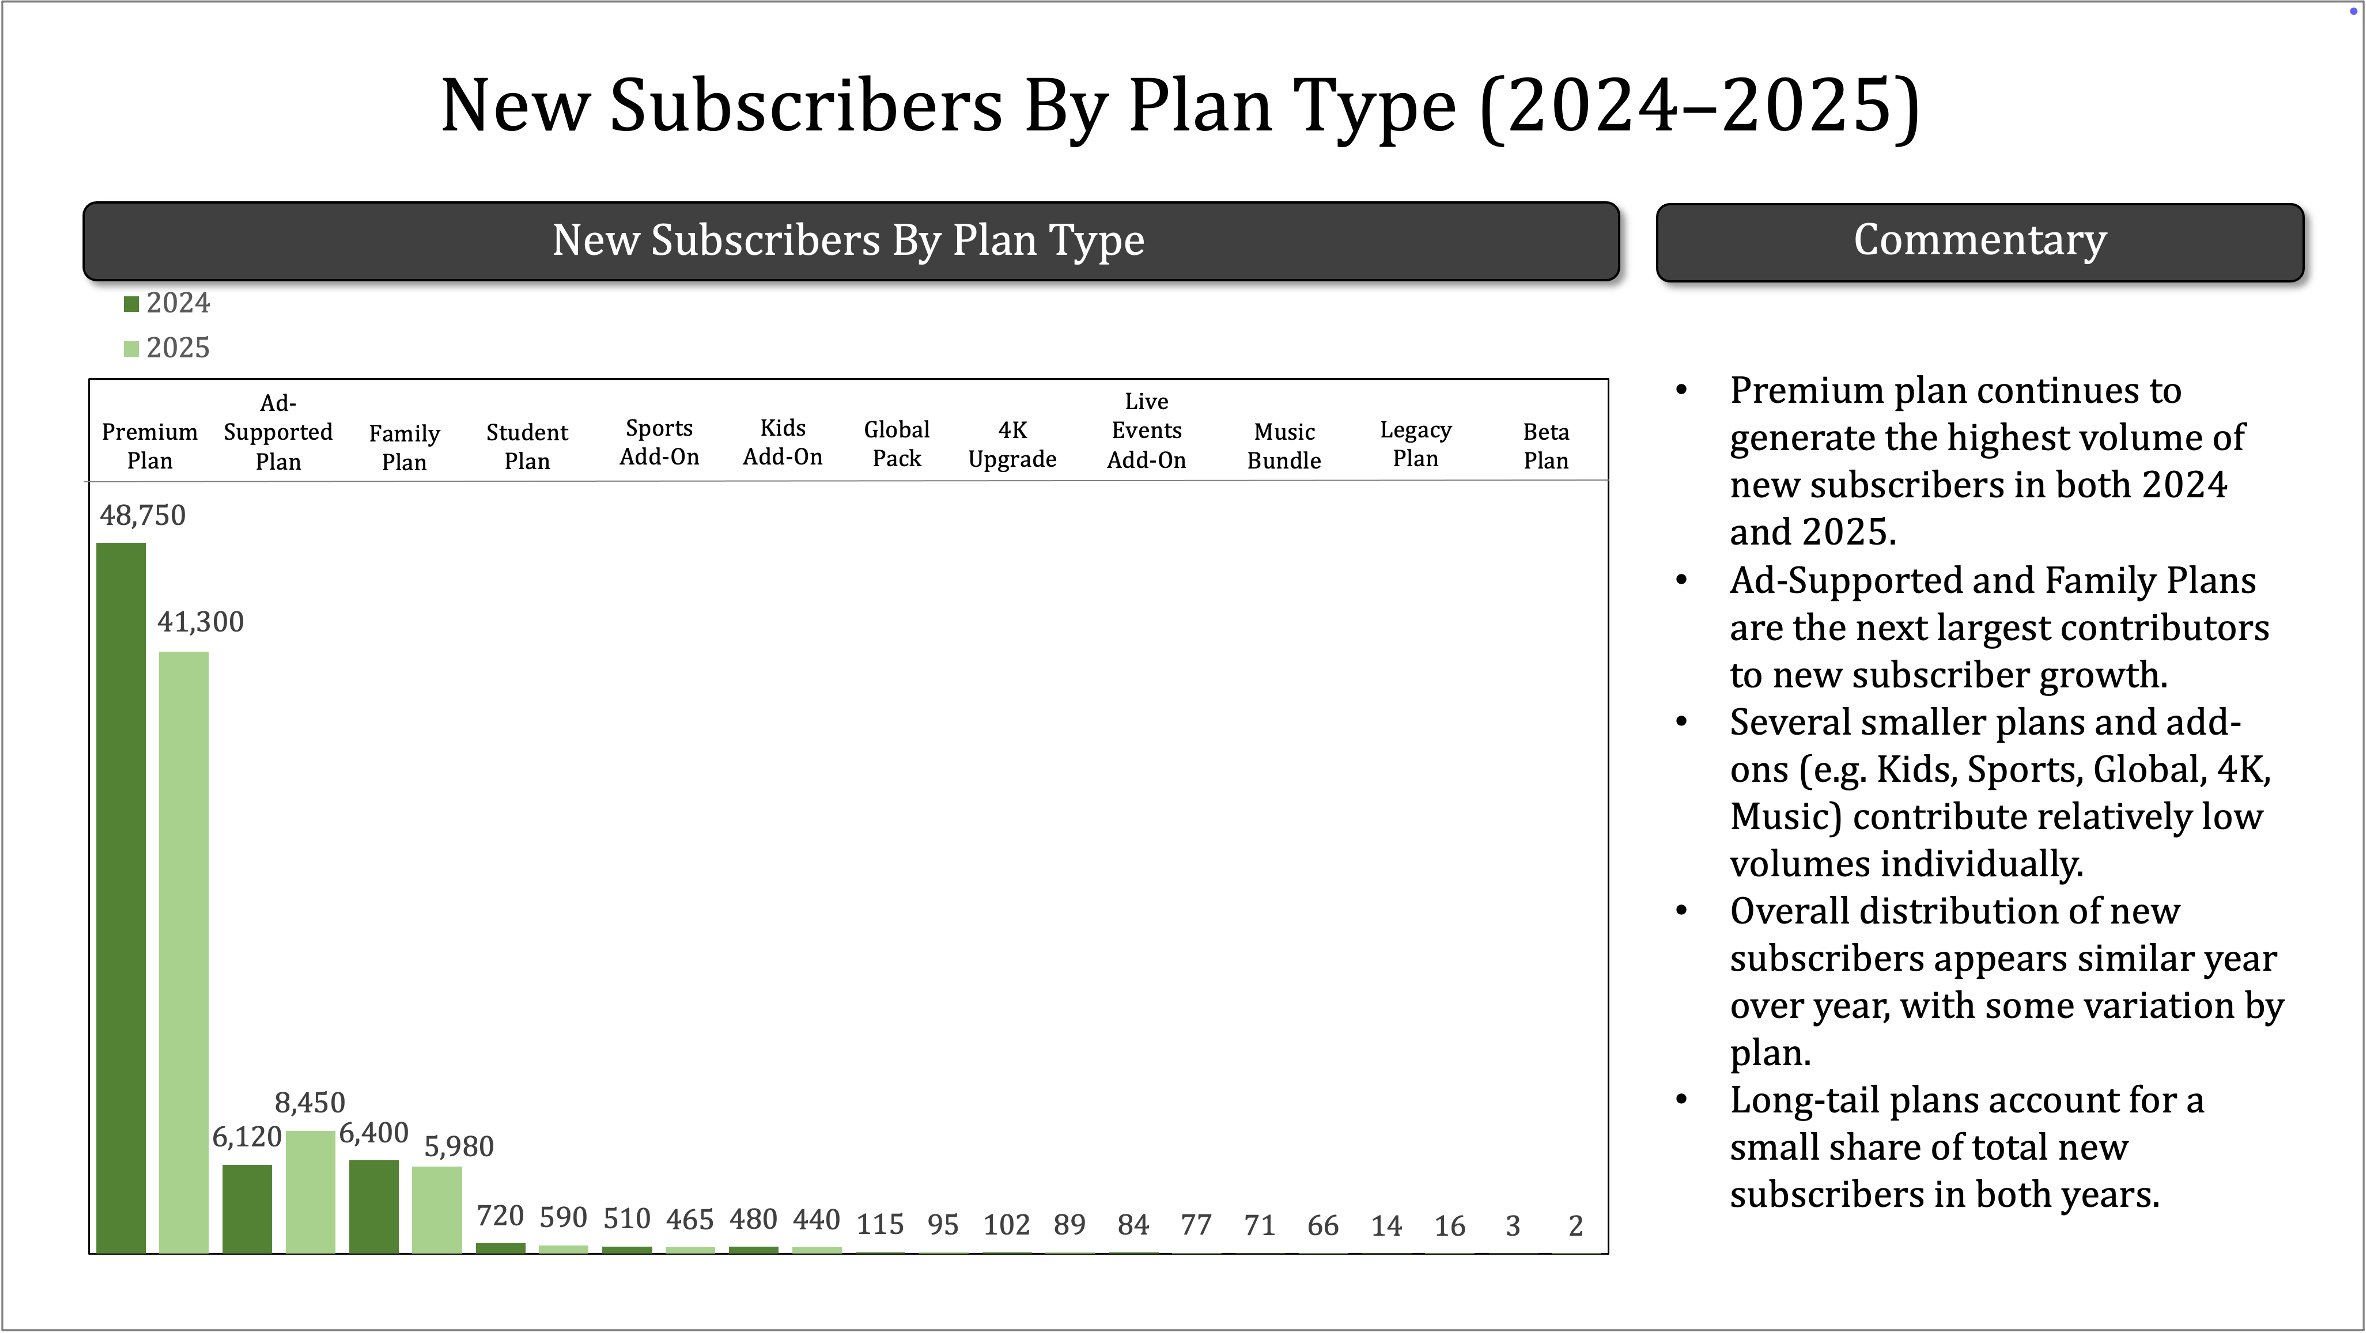
different takeaway, different graph
When one graph tries to do everything, it often ends up doing nothing particularly well. Cole shows how the same data can tell different stories—and how choosing a distinct graph for each can lead to clearer communications and better conversations.

what is a choropleth map?
Learn the ins and outs of choropleth maps in our latest chart guide post covering what a choropleth map is, how to interpret it, when to use it, and common pitfalls to avoid when using one.

move beyond busy bullets
Good content doesn't always need editing—it needs reorganizing. This real-world makeover shows how restructuring a bulleted list improves both scannability and comprehension.

explaining your job is a data storytelling opportunity
Your job title isn’t your job! Cole shares three practical storytelling techniques to help you explain what you do.

we’re hiring: join the storytelling with data team
Exciting opportunity: we’re adding to the SWD team! Click to learn more and apply.
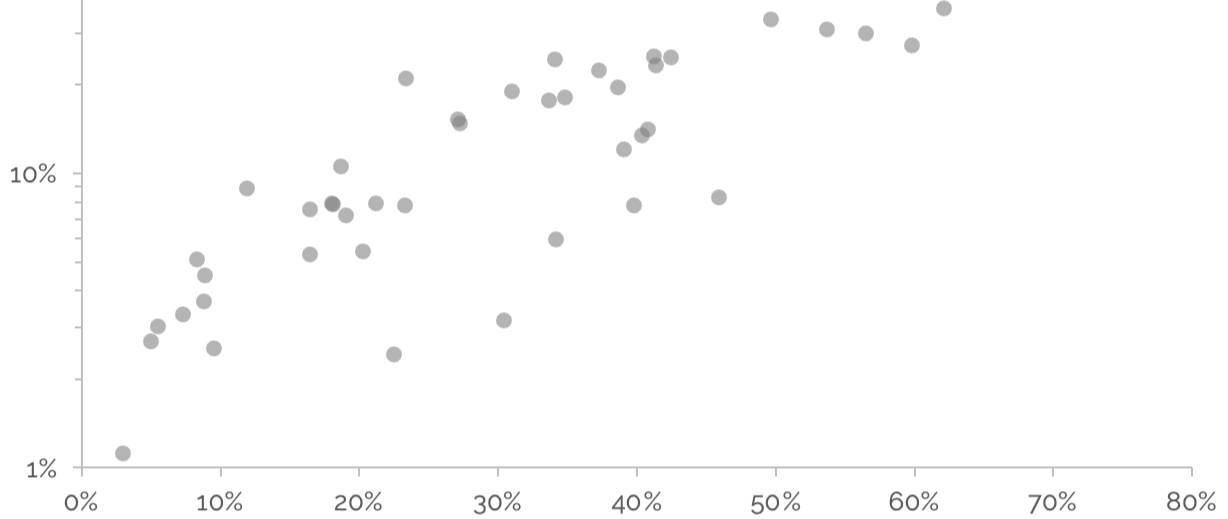
don’t let your axis scales distort the story
One of the most common pitfalls in data visualization is manipulating axis scales in ways that distort the story. This article explores alternatives to log scales.

looking ahead with intention
A new year is an ideal time to set clear intentions and invest in skill development. If communicating more effectively with data is one of your priorities, Cole shares a number of ways to learn with SWD.