#SWDchallenge: design for accessibility
Accessibility in graphs is more than just using colorblind-friendly palettes. It involves creating visual representations of data that are inclusive and easy to interpret for individuals with diverse needs. This includes factors such as color contrast, alternative text for images, clear labeling, and more.
In a prior guest post, Amy Cesal shared five ways to make data visualizations accessible:
Add alternative text: Alt text allows those using a screen reader to understand and engage with your visual.
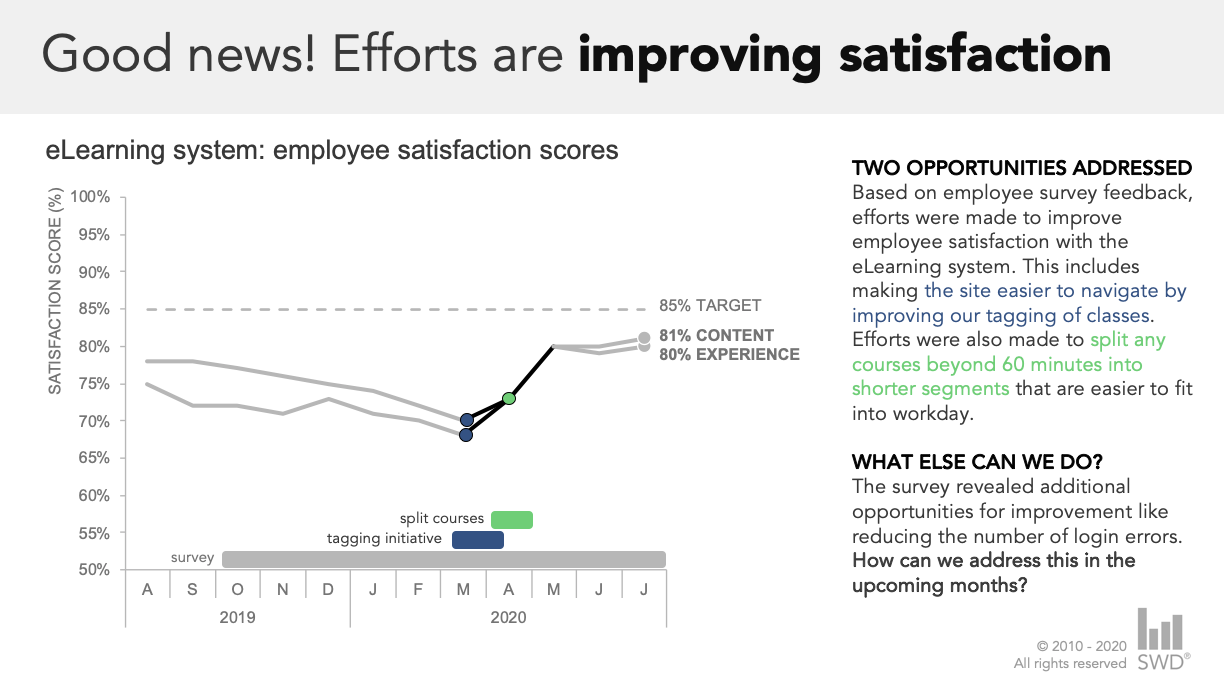
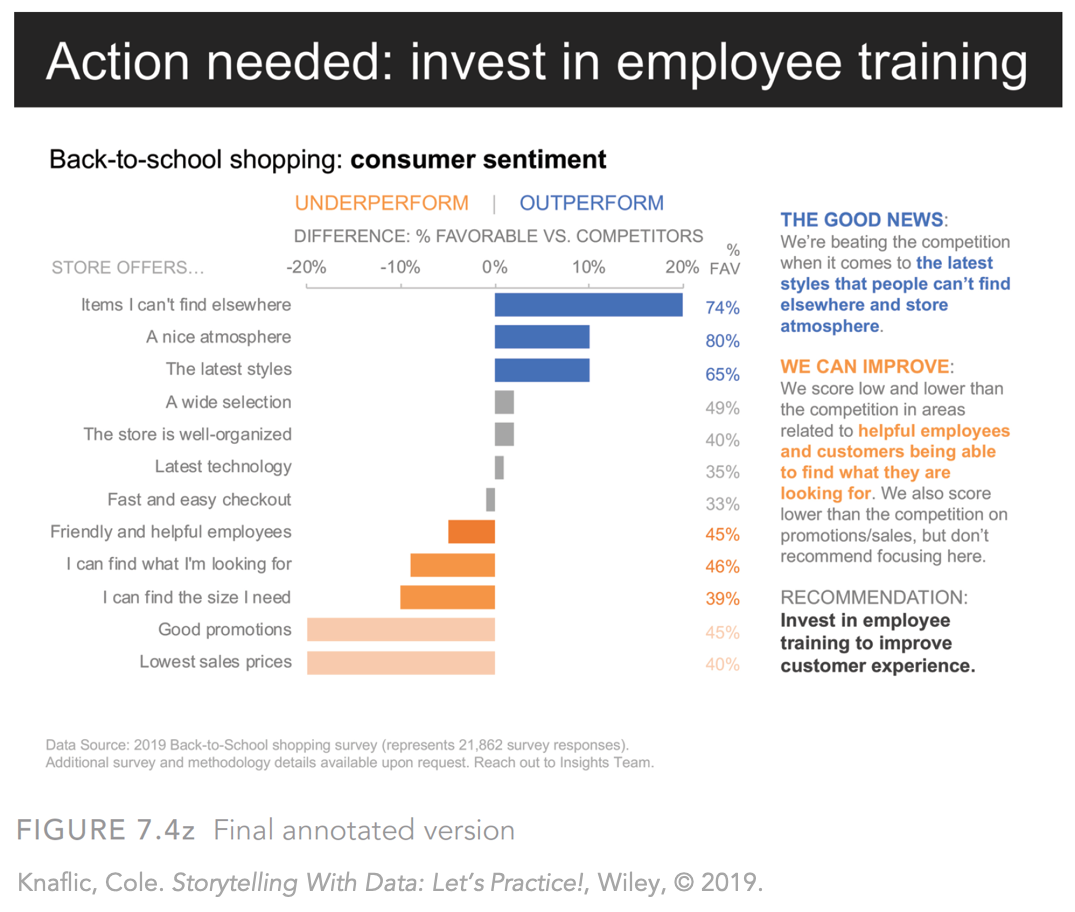
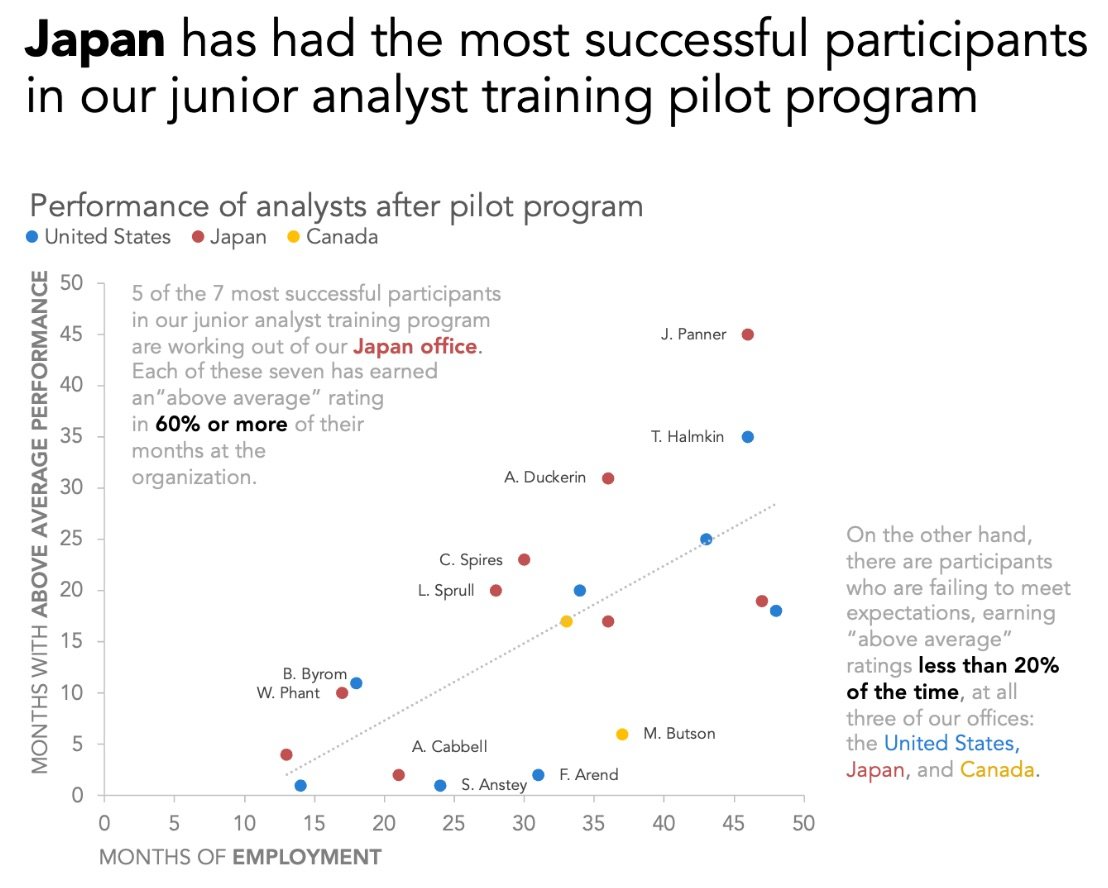
Employ a takeaway title: People tend to rephrase the title when asked to describe a graph, so clarifying the point can make graphs easier to understand and provide direction on where to look.
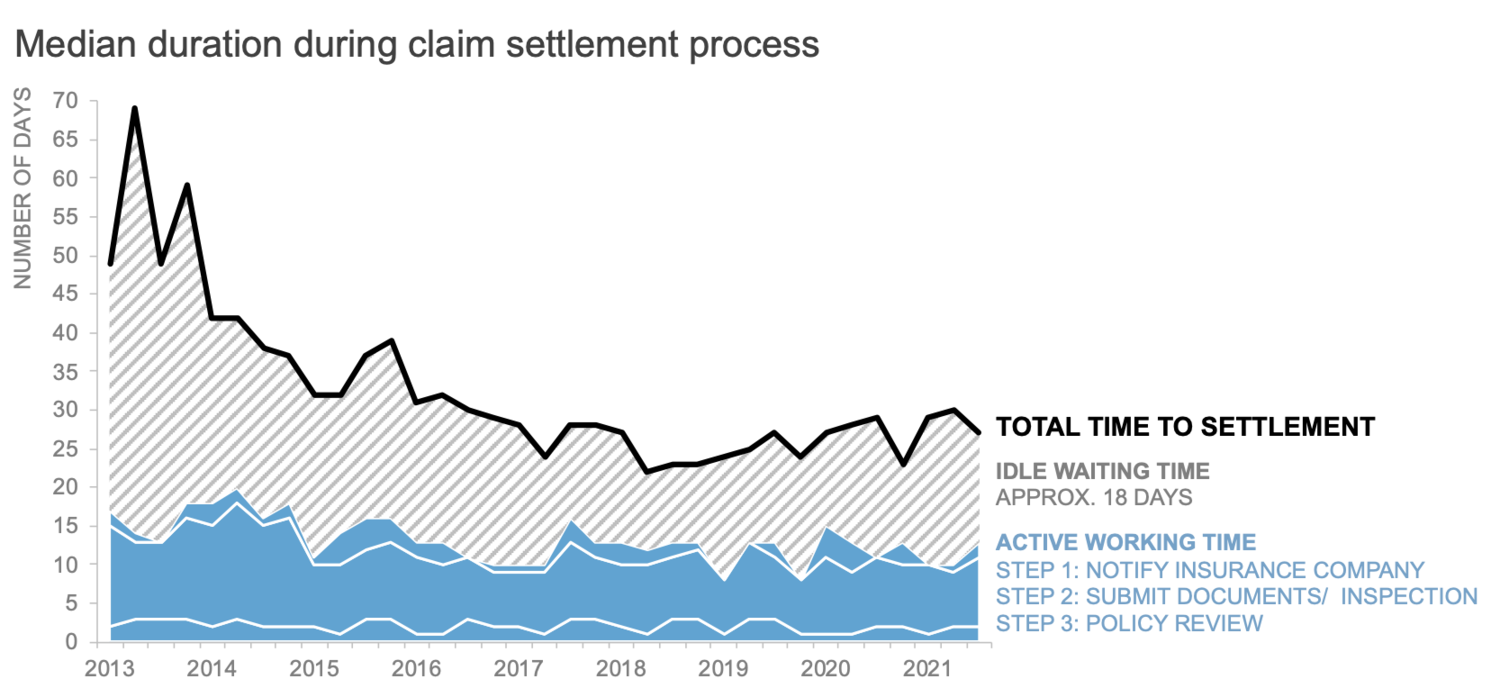
Label data directly: Instead of asking users to scan back and forth between the legend and data, opt for labeling the data directly. This is super useful when the colors in the graph are similar.
Use sufficient contrast: Without enough contrast, different elements on the graph will blend into one another, so ensure you are using a colorblind-friendly palette and that the contrast between any text and background colors is distinct enough.
Leverage white space: Adding space around graphical elements helps them stand out and increases legibility.
For this month's challenge, we invite you to design an accessible graph that is inclusive and informative for all audiences.
The challenge
Your challenge is to create a data visualization that prioritizes accessibility by incorporating features such as high color contrast, clear labeling, and alternative text descriptions for screen readers. Find a visualization that you think would benefit from being made more accessible. This can be a visual you find publicly available or perhaps even something you created on your own that you'd like to strengthen. If you use a real-world work example, take care to anonymize appropriately. The goal is to make your graph easily understandable for everyone.
Share your creation in the SWD community by Sunday, March 31 at 5PM ET. Take some time also to browse others’ submissions and share your input via comments and datapoints over the course of the month. We look forward to seeing your thoughtful and accessible graph designs!
Related resources
In addition to the guest post linked above, here are a few other related resources. If you are aware of other good ones, please share in your submission commentary.